
[ad_1]
On-chain analysis is a cryptocurrency-specific methodology that uses blockchain data to explain investor behavior and predict changes in the price of an asset. What can we do with it? Let’s find out!

On-chain analysis employs a variety of metrics derived from the cryptocurrency network, such as the total number and growth rate of addresses, changes in exchange balance sheets, the share of short-term and long-term holders, and so on.
The on-chain analysis tool is a set of indicators that establishes the relationship between changes in individual blockchain indicators and the price of a crypto asset.
On-chain analysis is a relatively new discipline that, unlike technical or fundamental analysis, lacks a long history and a solid theoretical foundation but is actively developing.
On-chain analysis researchers use a set of basic metrics related to cryptocurrency addresses and holders, transactions, and network fees.
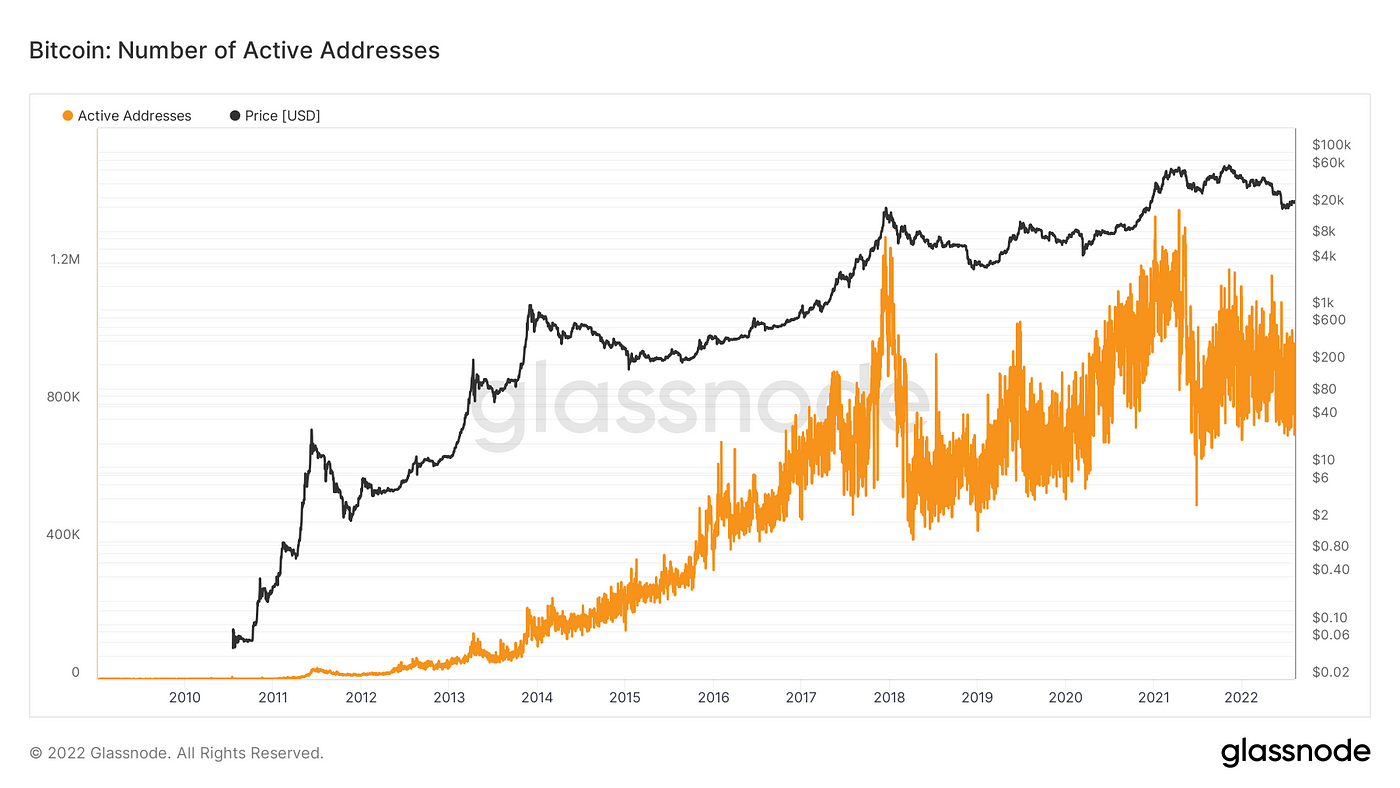
The number of active users, or those who have made at least one transfer within a certain time period, is one of the most popular indicators. If the number of active addresses and transactions for a cryptocurrency increases, it may indicate that its price will soon begin to rise.
Blockchain may exhibit additional signs of this trend. For example, an increase in the proportion of long-term investors among all coin holders, i.e. those who have not moved their funds in a long time, indicates a “bullish” mood.
With the help of on-chain analysis, a trader or investor can not only improve their own trading strategy, but also better understand what market movements may occur in the near future.
The so-called HODL Waves are one of the fundamental on-chain indicators: addresses in the cryptocurrency network are divided into several groups based on their activity and represent the change in the share of each group on the timeline. The Hodl wave can tell you whether traders expect the coin’s price to rise or fall.

According to experts, it is not sufficient to draw conclusions solely based on on-chain metrics or indicators: you must also understand the context of a specific crypto asset. For example, the high proportion of long-term holders of cryptocurrencies may be due to vesting conditions for large investors rather than investor expectations.
Another popular on-chain metric is the share of cryptocurrency concentration, which shows the percentage of the coin’s total turnover by the largest addresses. It is possible to determine the dominance of “whales” using this method.
Many analysts monitor the activity of large holders of a particular cryptocurrency, whose actions, depending on the context, can serve as an additional argument in favor of a particular market forecast. Large transactions, in particular, are tracked and published on Twitter by the Whale Alert channel.
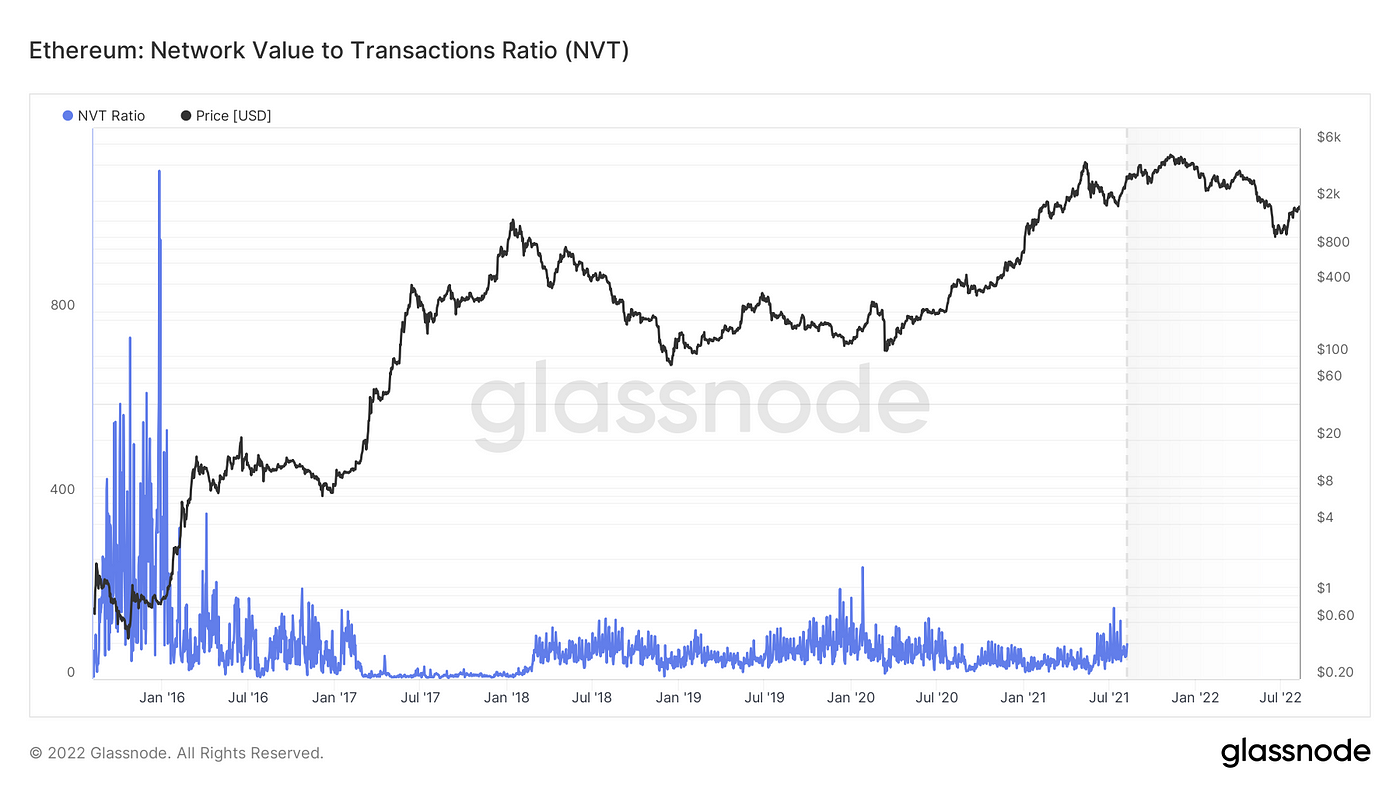
NVT Ratio
The ratio of market capitalization to transaction volume expressed in US dollars. The high NVT Ratio value indicates that the coin has been “overbought.”
MVRV Ratio
The ratio of the current capitalization to the realized one. Indicates whether the asset price is below or above the “fair” level.
The number of active addresses
It depicts cryptocurrency demand and usage.
The influx of bitcoin to exchanges
It demonstrates the intentions of large investors. The positive dynamics of the stock exchanges’ balance sheets indicates the dominance of “bears”, the negative — bullish sentiment.
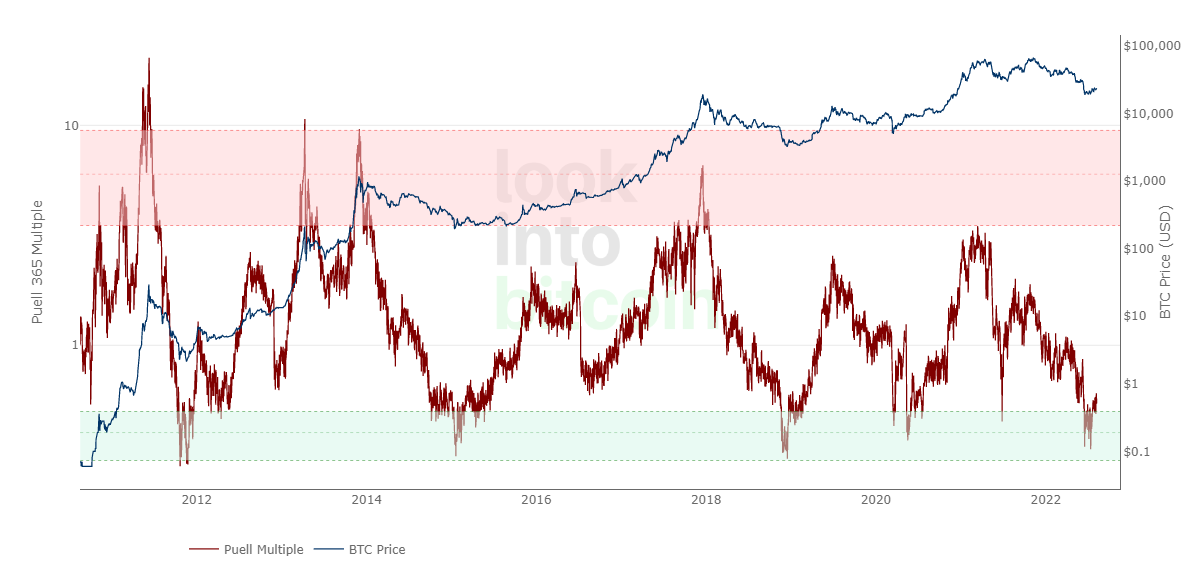
The Puell Multiple
It is the ratio of the number of bitcoins mined per day (in dollars) to the 365-day moving average value. It is used to determine the best times to buy and sell the first cryptocurrency.
Aside from trading and investing, on-chain analysis is used to comply with anti-money laundering legislation (AML), that is, to detect stolen cryptocurrencies.
Companies and applications that accept payments using blockchain addresses, such as cryptocurrency exchanges, must screen incoming user transactions for the presence of “dirty” assets. Such services are provided by specialized services such as Chainalysis or Crystal.
These programs automatically check all incoming transfers and, thanks to the openness of blockchain data, detect crimes among them. Client due diligence (CDD/EDD) and verification procedures (KYC) allow for the identification of criminals and related persons.
There are now several popular platforms that provide on-chain analysis tools, specifically API and visualization of blockchain data:
- Nansen. It is focused on the analysis of the Ethereum blockchain. Publishes its own research on the cryptocurrency market.
- Dune Analytics. A platform with the ability to create customized dashboards that visualize various on-chain metrics. Develops a community whose members share observations with each other.
- Glassnode. Another popular service with the ability to view standard charts for free.
If you have anything to add to the on-chain analysis topic, welcome to our comments!
In terms of tracking the updates, subscribe to our Medium feed.Stay tuned!
New to trading? Try crypto trading bots or copy trading
[ad_2]
Source link