
[ad_1]
Market participants are going through a period of fear and uncertainty as the FTX exchange has recently announced bankruptcy after facing a massive liquidity crunch. As a result, Bitcoin plunged and marked a new low at $15.5K.
Technical Analysis
By Shayan
The Daily Chart
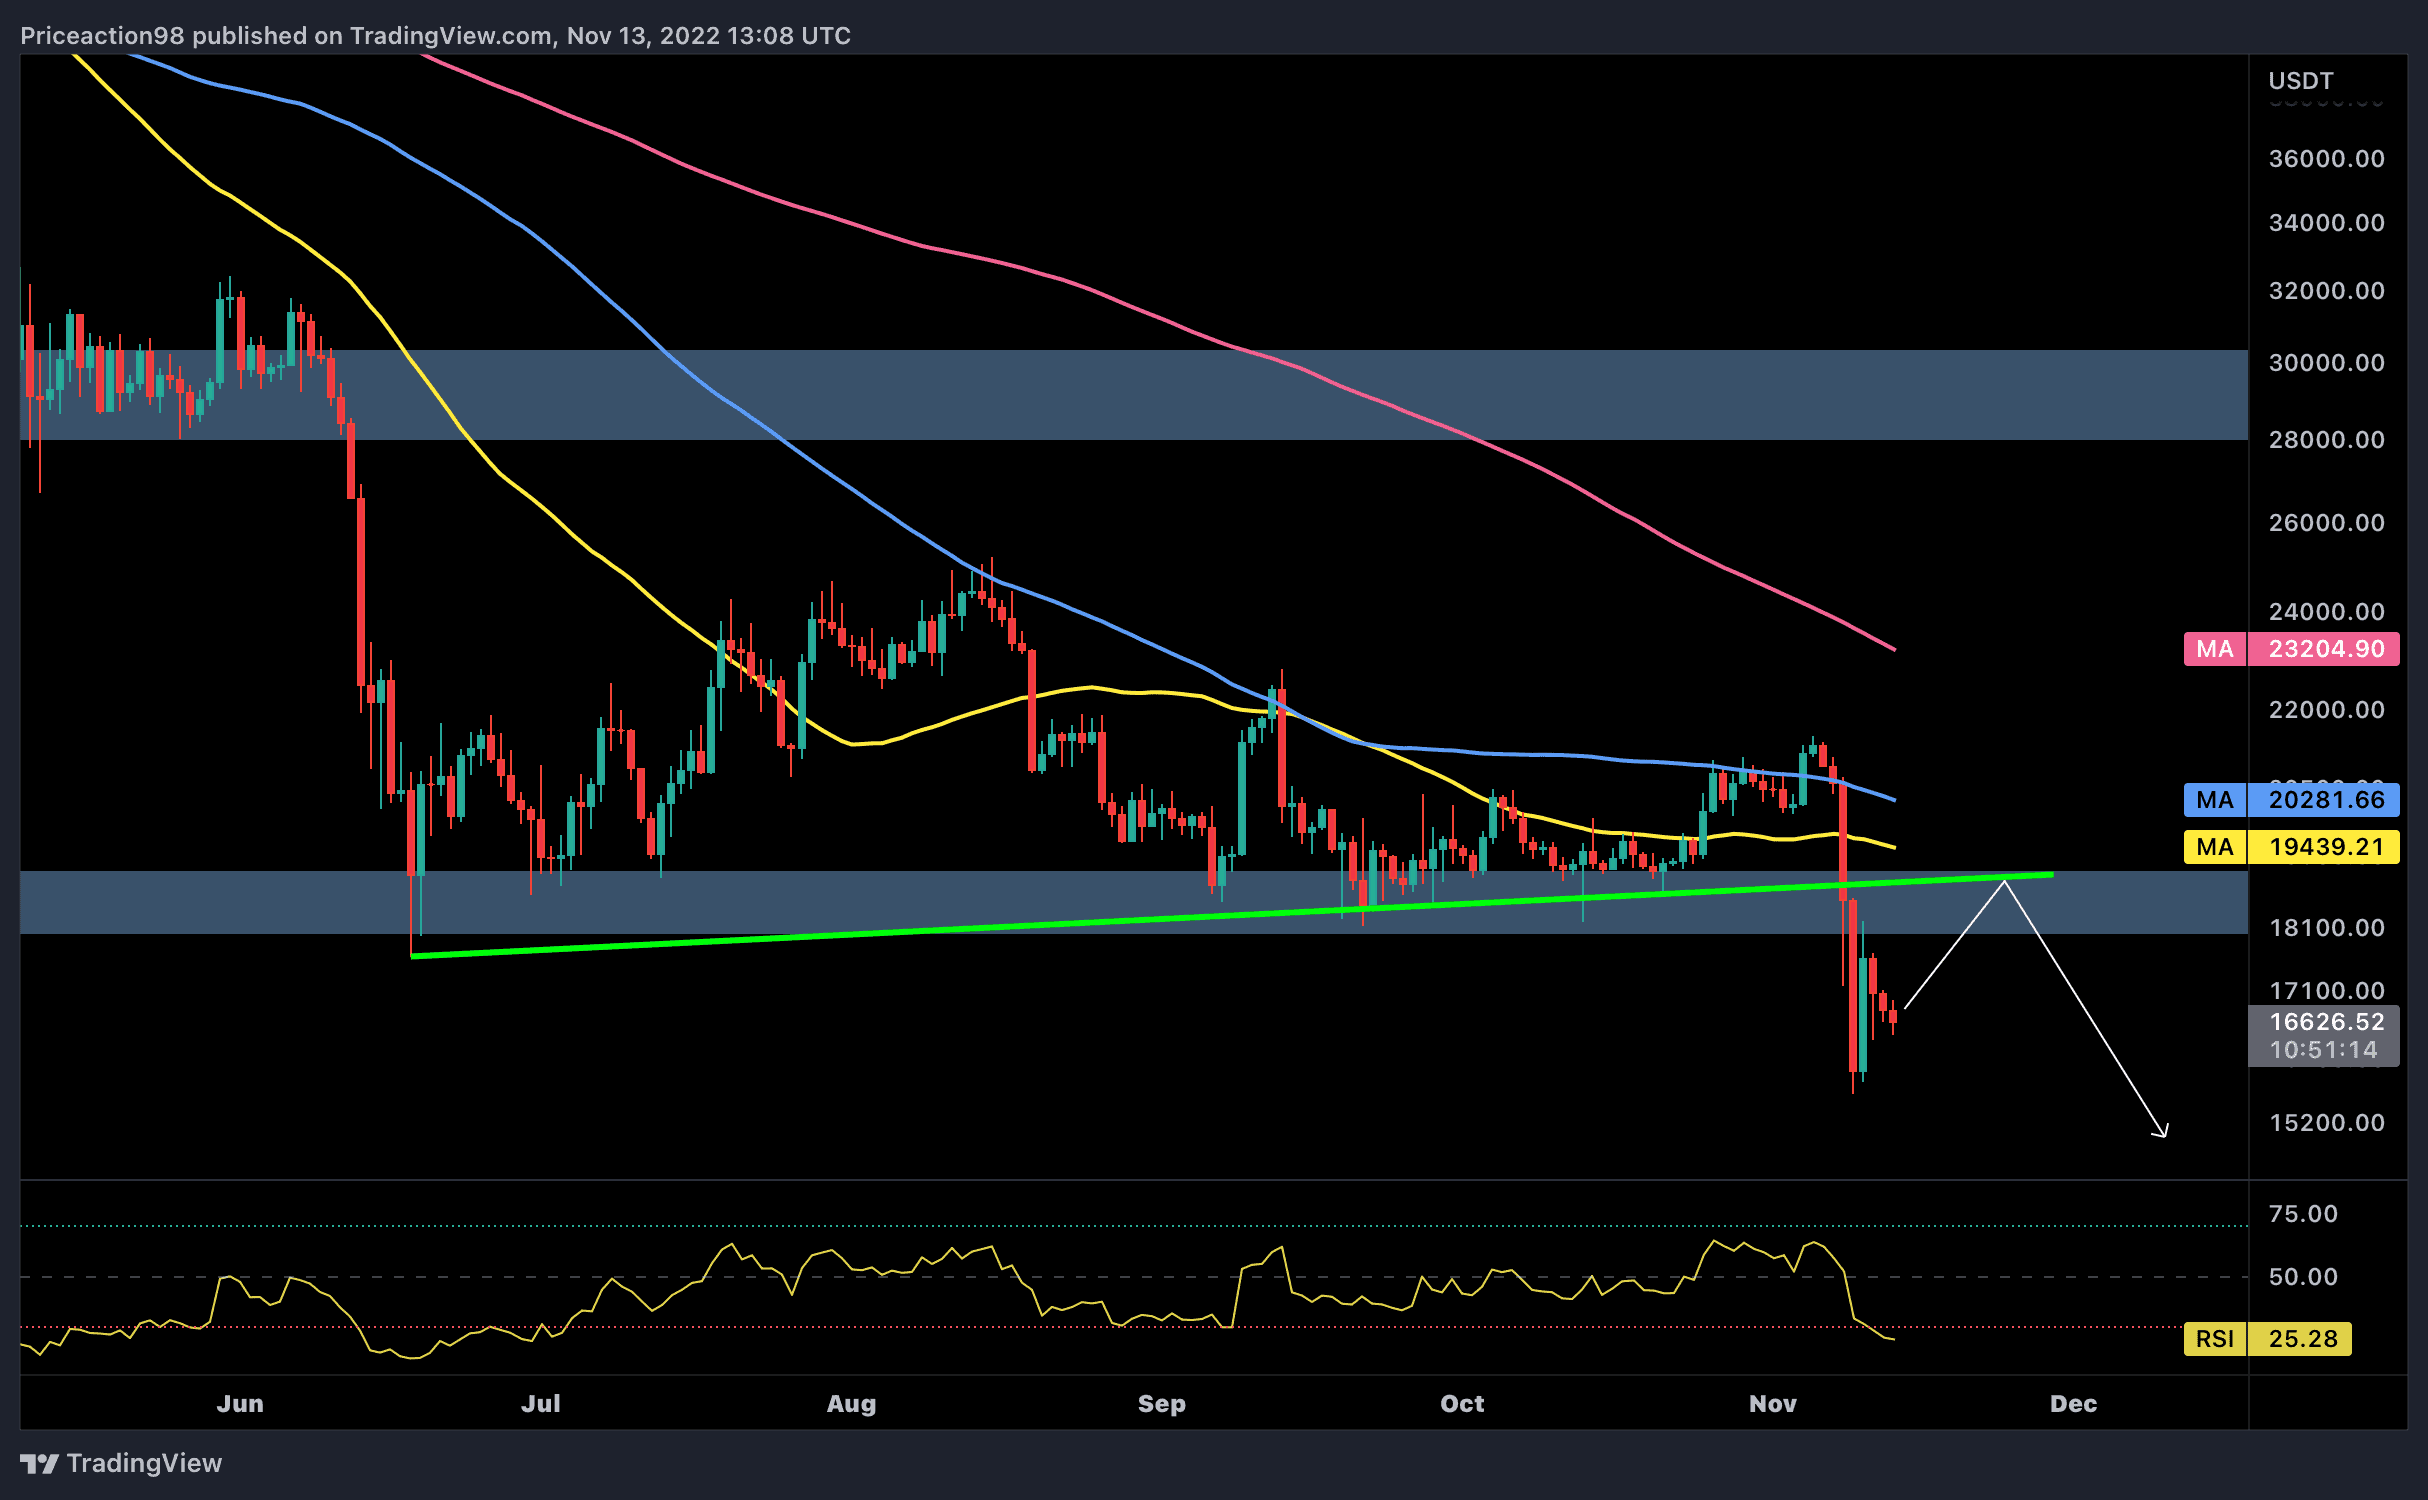
The $18K level had been supporting the price for several months. However, Bitcoin was recently rejected and experienced a massive shakeout, plunging beneath it following massive bearish momentum.
The market has likely entered a new consolidation range as the price dropped significantly. Nevertheless, during this phase, the price might retest the $18K level and the broken trendline in the form of a pullback and then continue the bearish trend toward the $15K level.
The 4-Hour Chart
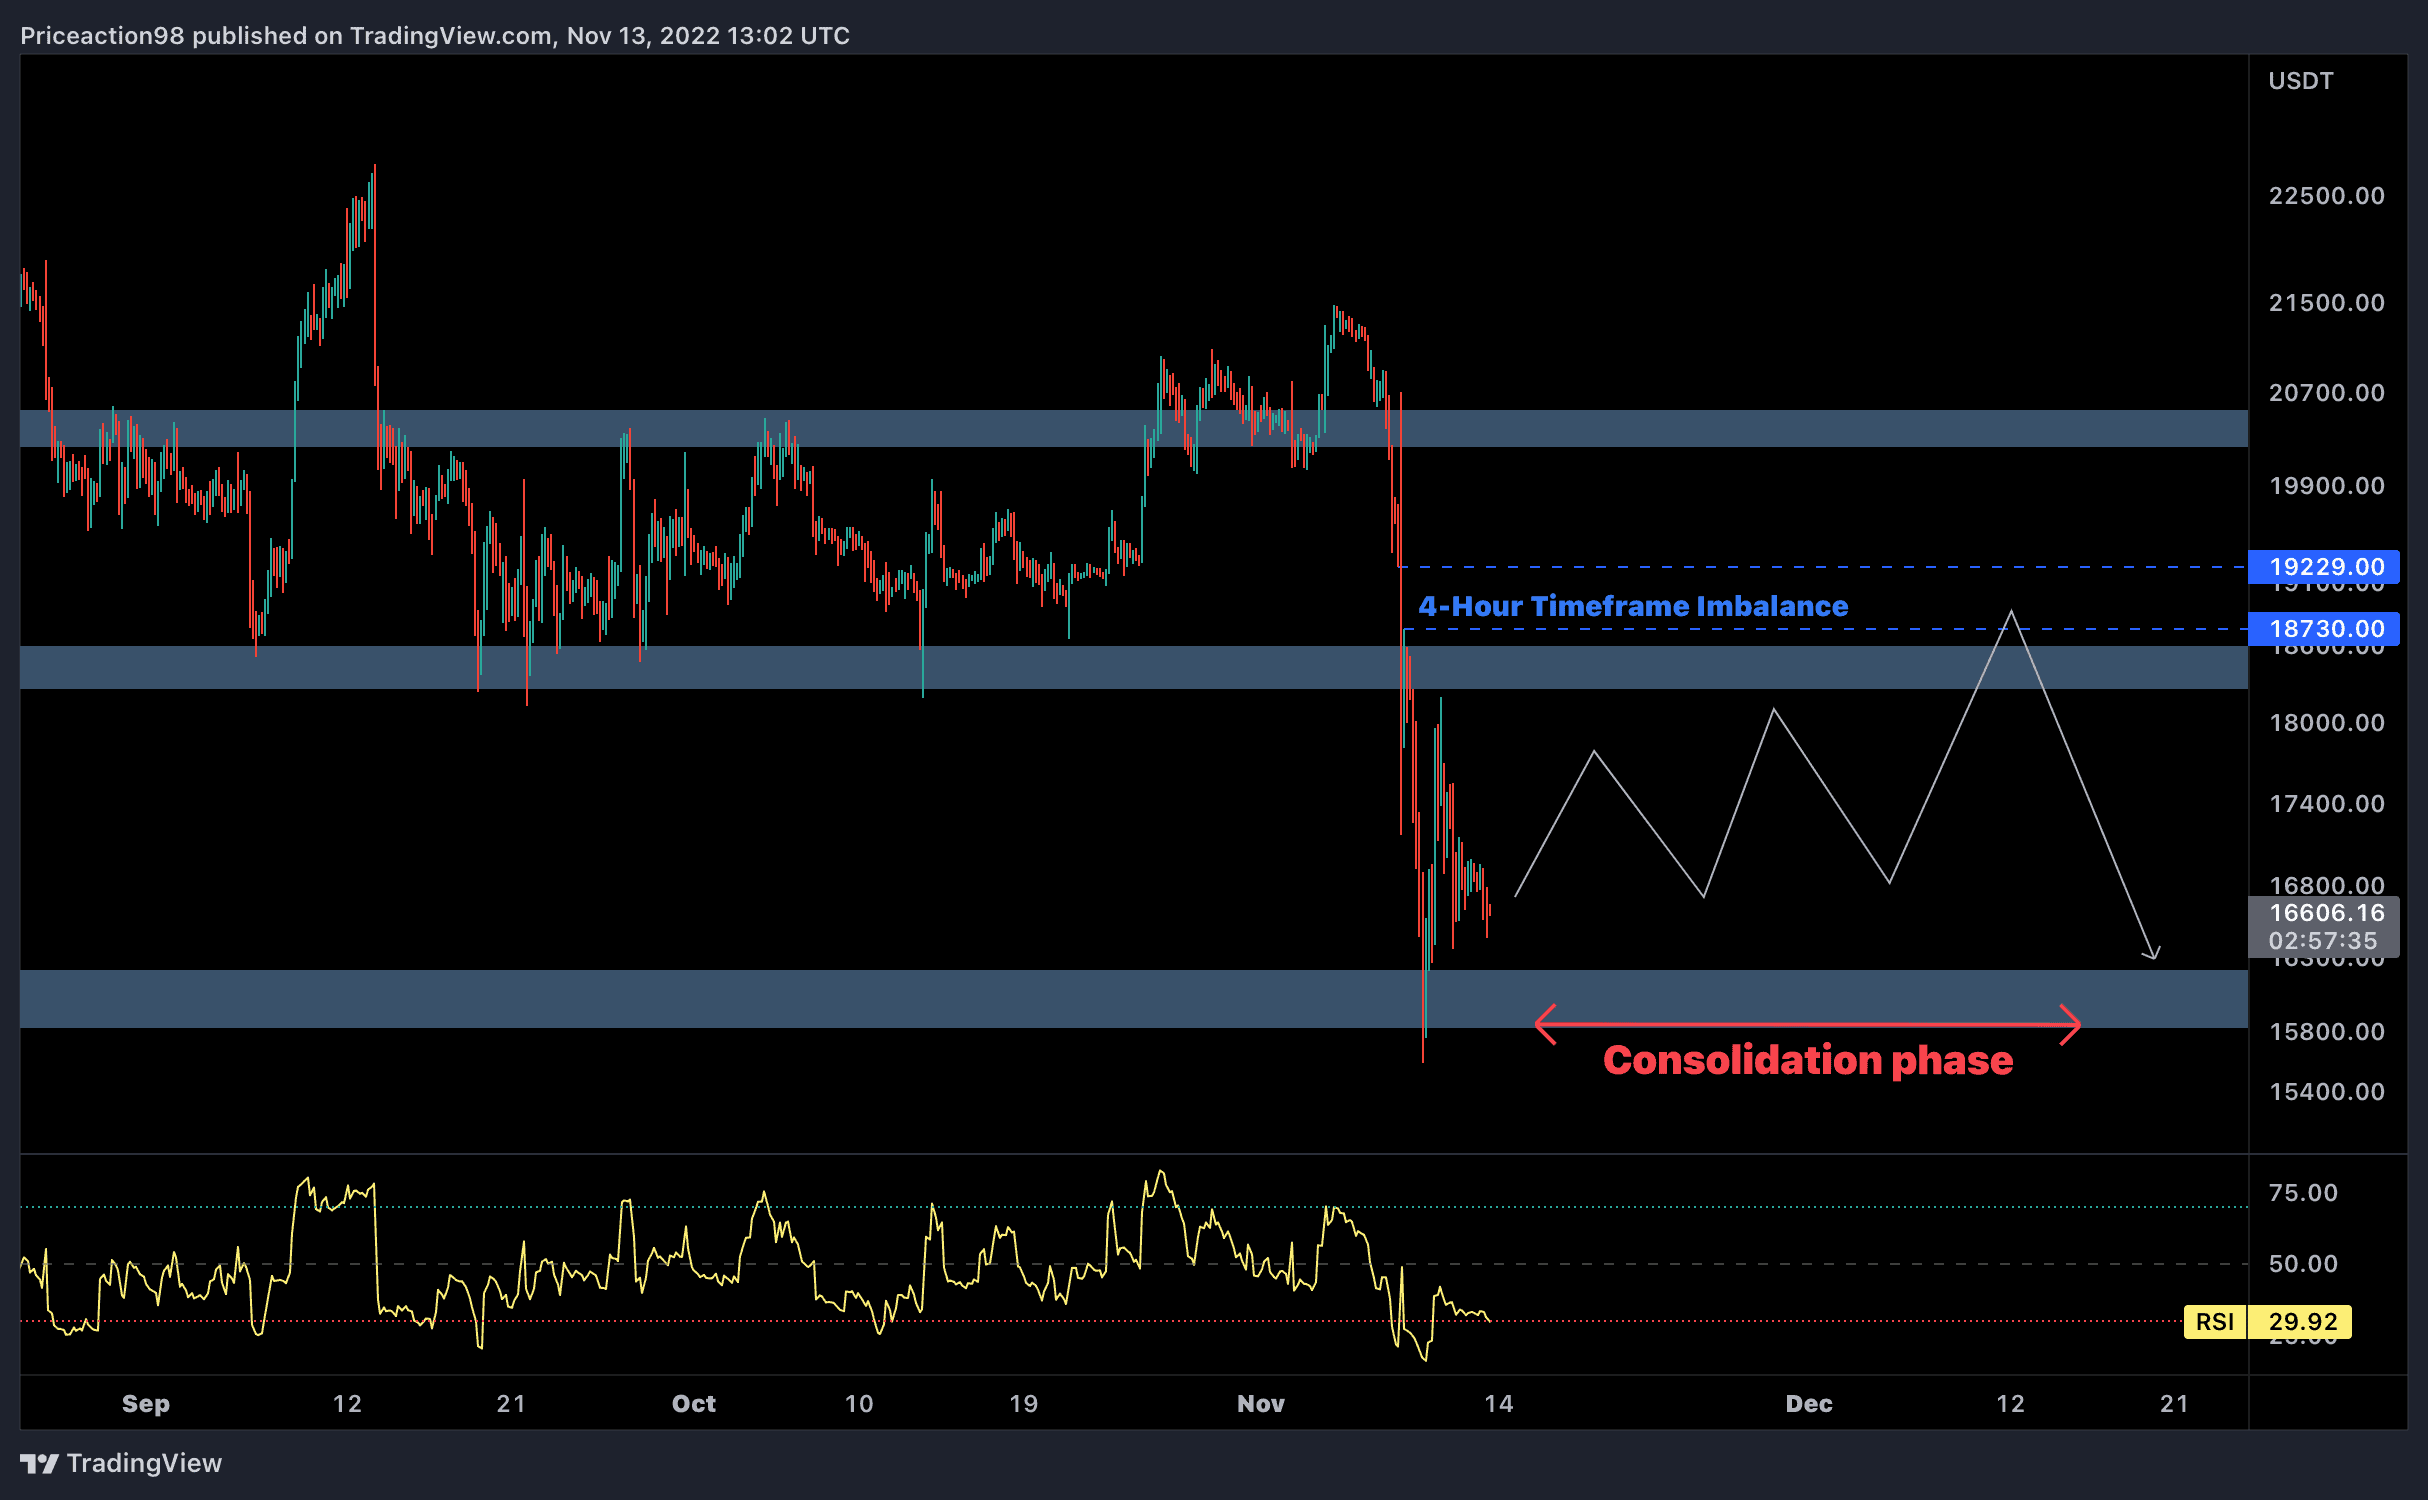
Typically, after an expansive move, the market enters a short to mid-term consolidation phase and forms continuation correction patterns. This phase usually includes high volatility and futures market liquidations.
Furthermore, during the recent cascade, an imbalance has been formed in the 4-hour timeframe between the $18.7K and $19.2K levels. The price will probably consolidate toward the $18K level and use the existing imbalance to continue the bearish trend toward the $15K support region.
Onchain Analysis
Onchain Analysis By Shayan
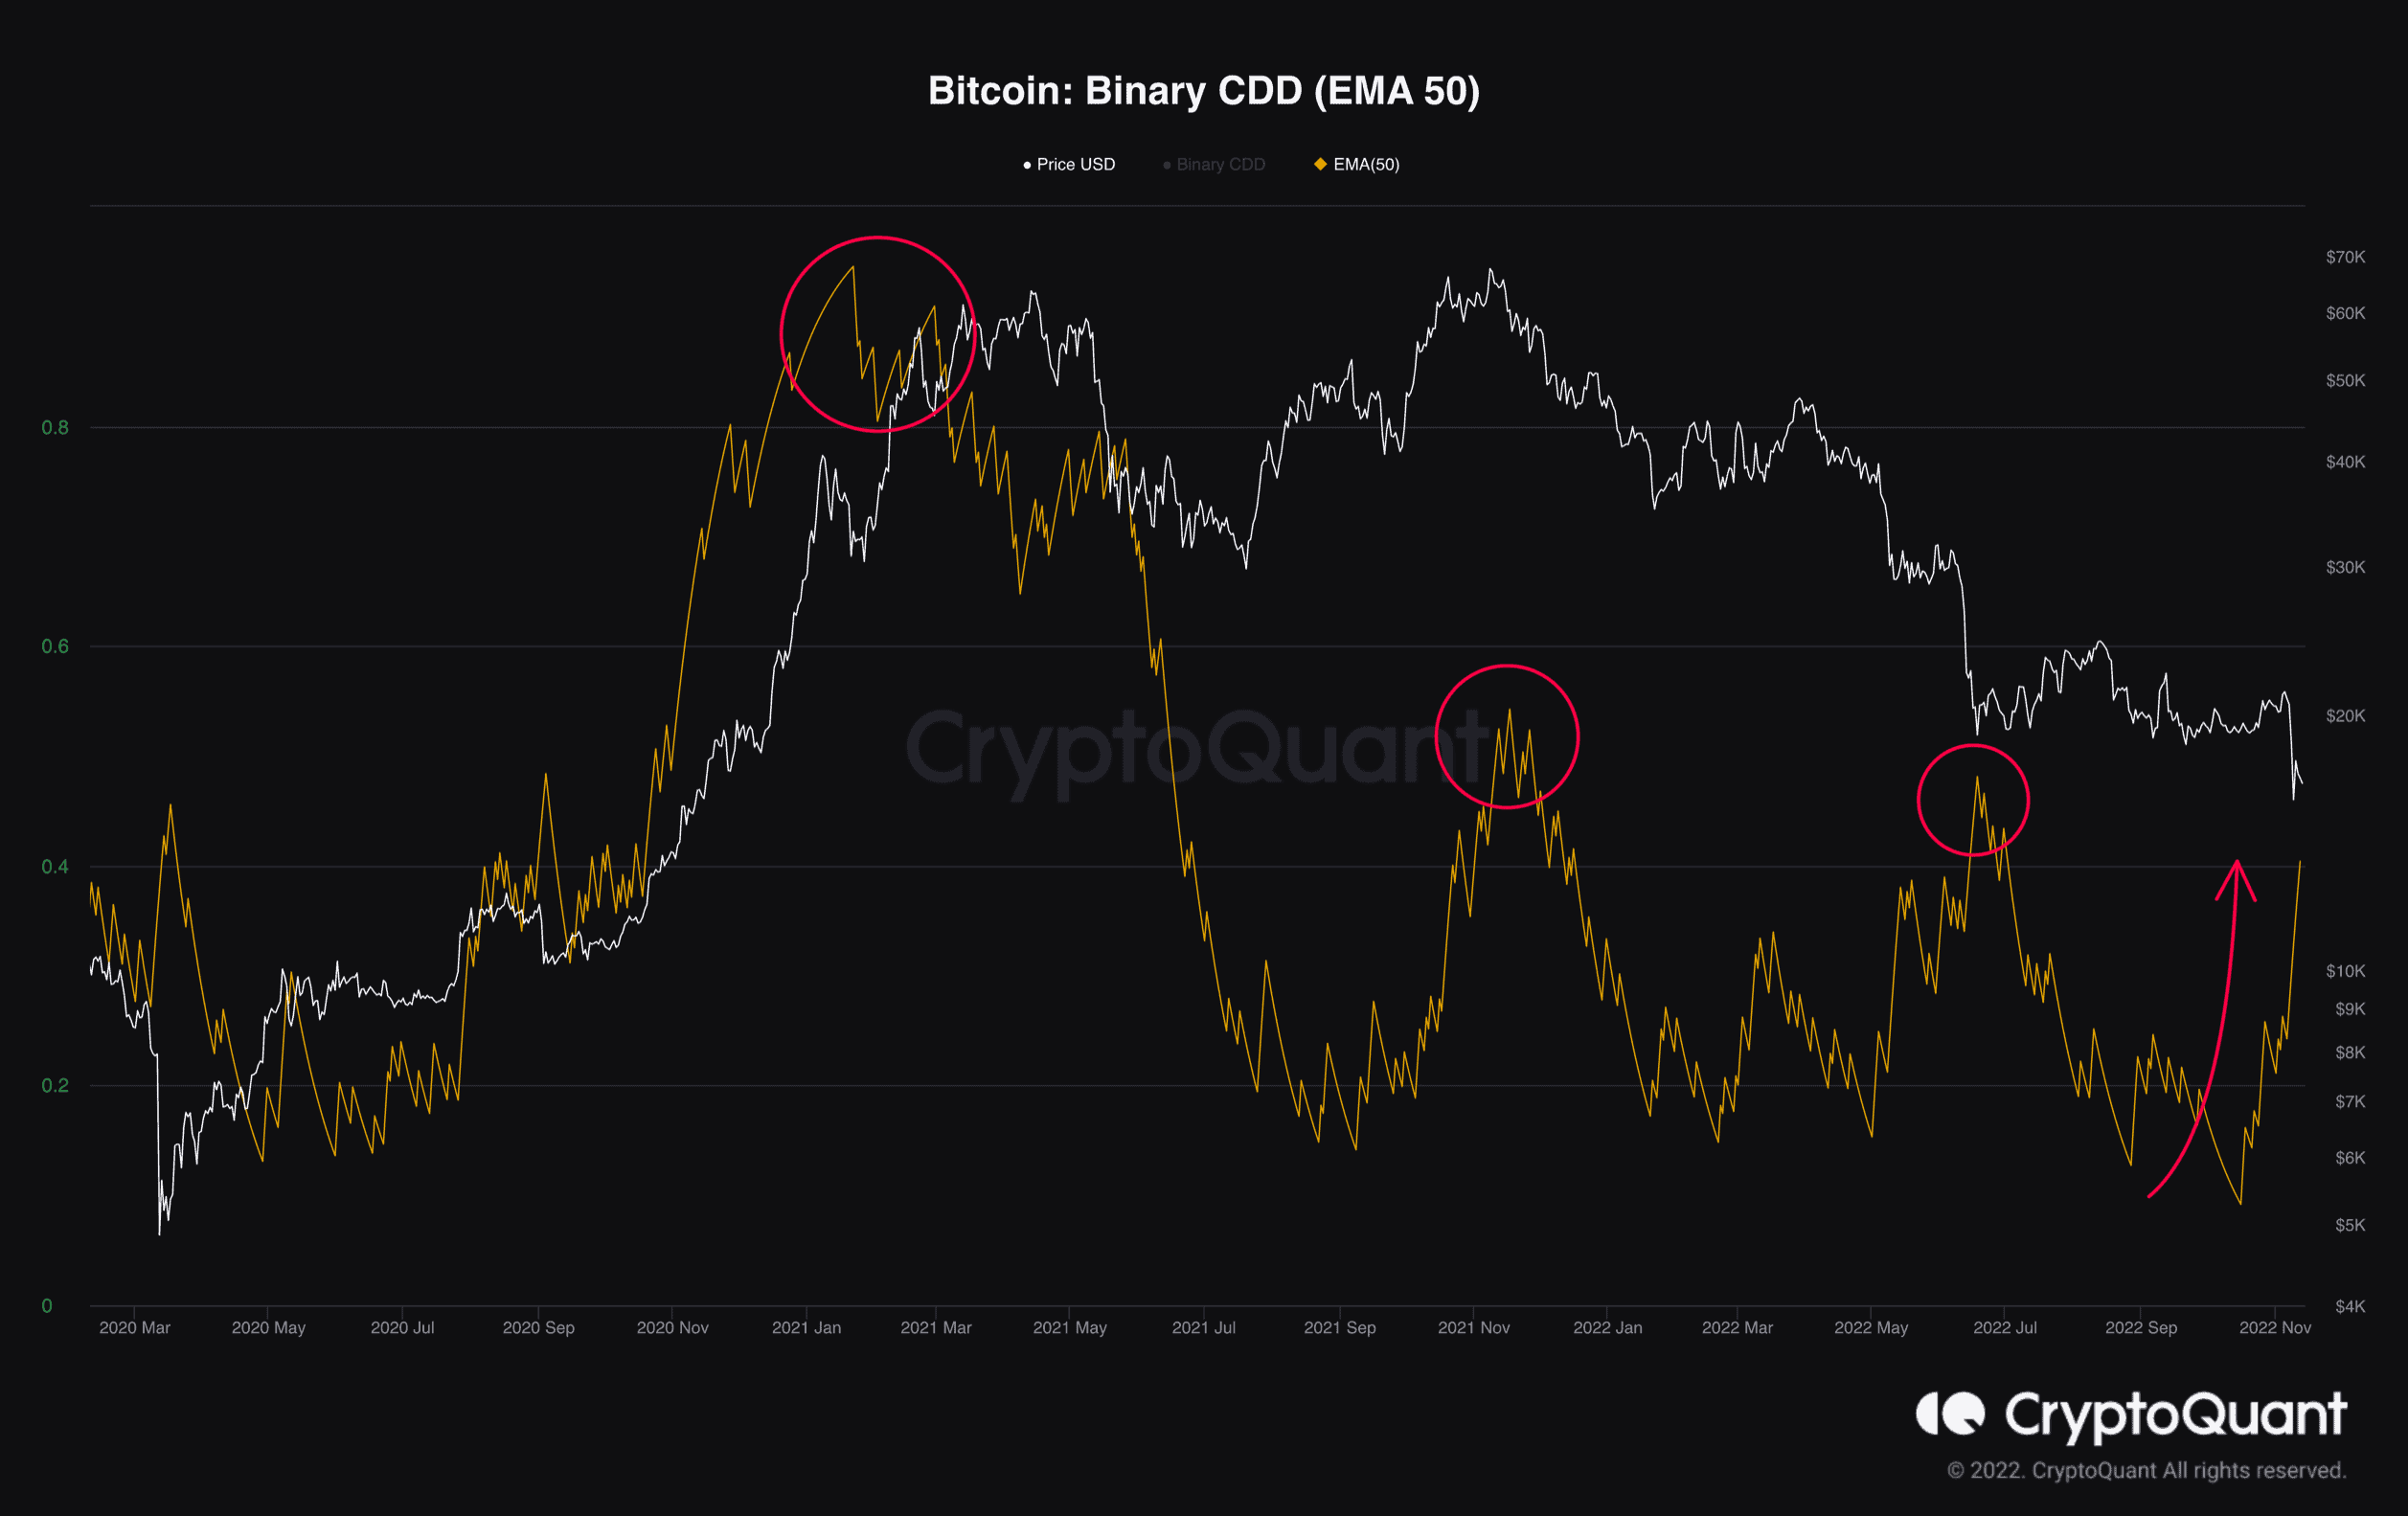
Long-term holders are an important group of market players, and following their activity can help predict market direction. The Binary Coin Days Destroyed metric may be used to track the behavior of this cohort. It points to 1 if Supply Adjusted Coin Days Destroyed is more than the average Supply-Adjusted CDD and 0 otherwise.
The following chart shows the Binary CDD metric (50-day EMA) and Bitcoin’s price. A surge in the metric determines possible selling pressure from the long-term holders. Currently, it has surged significantly and marked a new short-term high. This is due to the FTX’s fallout and liquidity crunch, which resulted in a new stage of panic and capitulation.
This surge revealed a massive selloff from the long-term holders to realize their losses. If the metric continues spiking, the market should expect deeper price levels soon.
Binance Free $100 (Exclusive): Use this link to register and receive $100 free and 10% off fees on Binance Futures first month (terms).
PrimeXBT Special Offer: Use this link to register & enter POTATO50 code to receive up to $7,000 on your deposits.
Disclaimer: Information found on CryptoPotato is those of writers quoted. It does not represent the opinions of CryptoPotato on whether to buy, sell, or hold any investments. You are advised to conduct your own research before making any investment decisions. Use provided information at your own risk. See Disclaimer for more information.
Cryptocurrency charts by TradingView.
[ad_2]
Source link