
[ad_1]
Bitcoin’s short-term price action is still hanging in the balance, as it is currently consolidating in a key area. The next few days could determine whether the recent rally was really the beginning of a new bull market or just another bull trap.
Technical Analysis
By: Edris
The Daily Chart
On the daily timeframe, after breaking above the long-term bearish trendline and retesting both the trendline and $18K, the price has been trapped between two significant dynamic levels; the 50-day and 100-day moving average lines, located around $20K and $21K.
The cryptocurrency has been consolidating in this range since breaking the 50-day moving average to the upside but is yet to close above the 100-day MA.
A bullish breakout could lead to a rally toward the 200-day MA and the $24K resistance level, which are both strong barriers to be surpassed before anticipating the beginning of a new bull market.
On the other hand, in the event of a deeper pullback, the significant $18K support level could come into play once more. However, it may not be reliable as it has already been tested on multiple occasions recently and, as a result, should be considerably weakened.

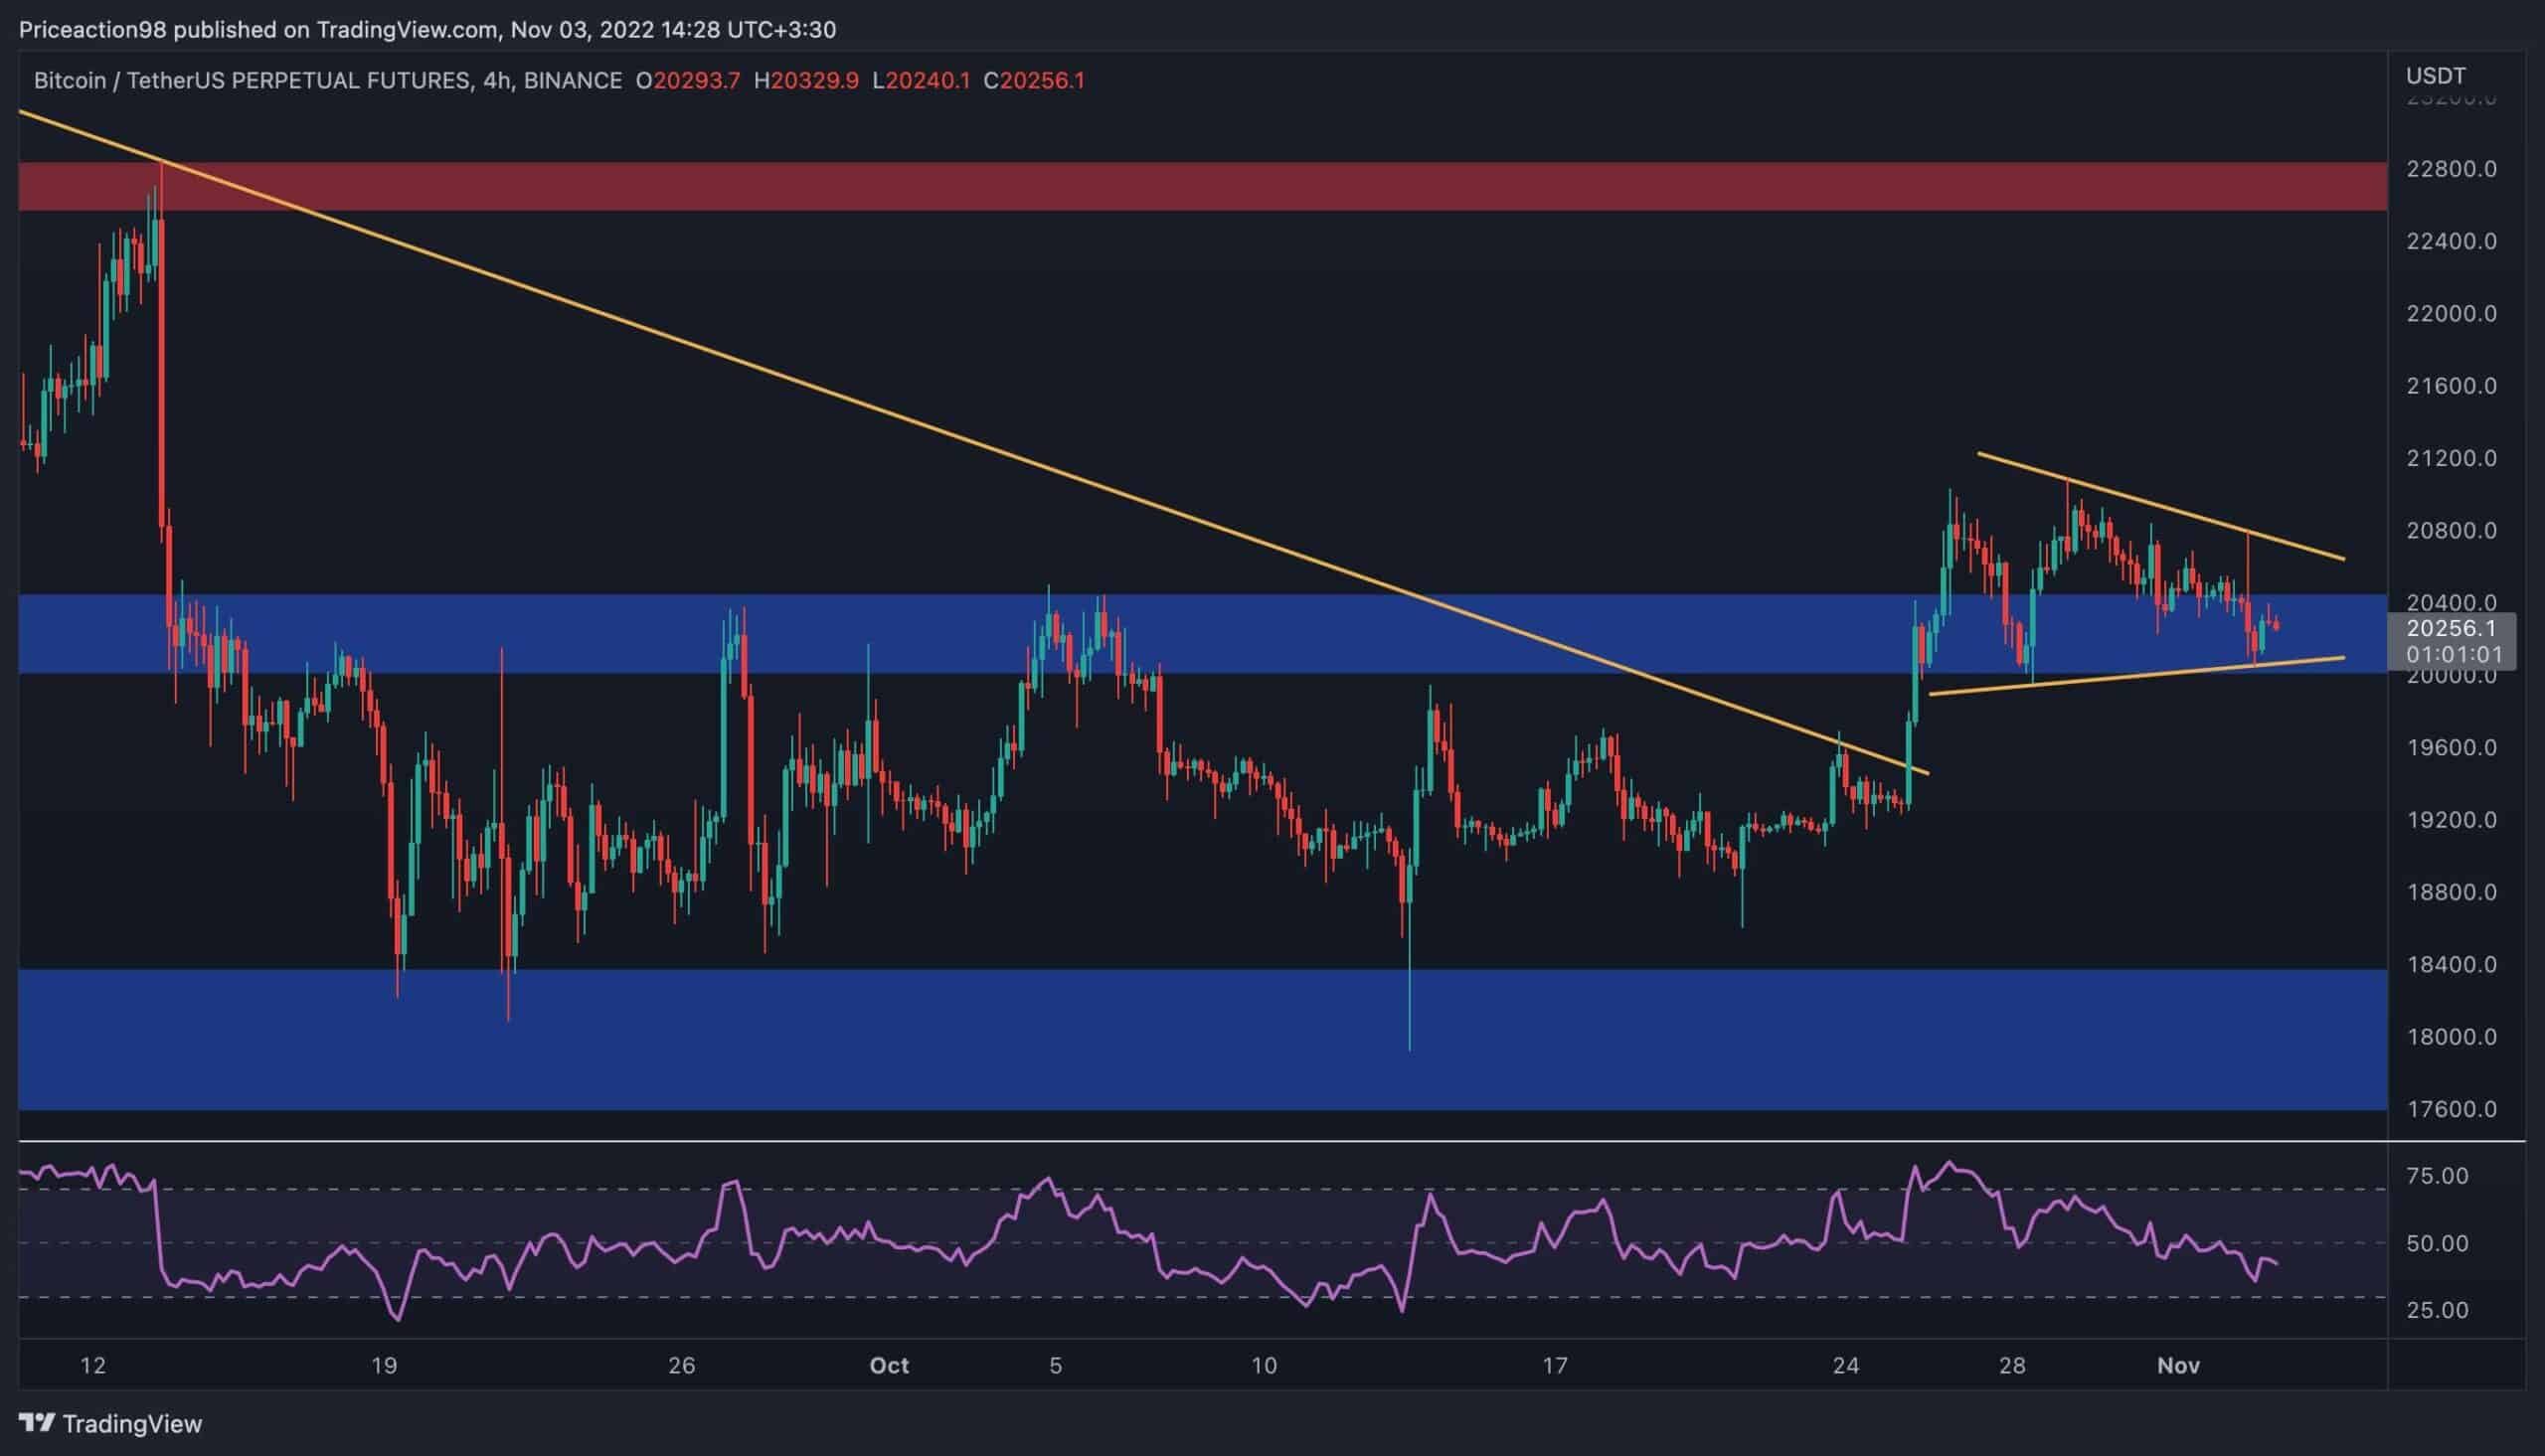
The 4-Hour Chart
On the 4-hour timeframe, the price has been consolidating around the $20K area for the last few days after breaking above both the $20K level and the long-term bearish trendline.
A symmetrical triangle is seemingly forming in this timeframe and could offer a useful framework for analysis. These patterns could be either sign of continuation or reversal, depending on the direction in which a valid breakout occurs.
A break below this triangle could lead to a drop toward the $18K level, and conversely, a breakout to the upside would likely initiate a rally toward the $22,500 resistance level.
Furthermore, the RSI indicator is currently trending below the 50% level but is still far from the oversold area, indicating that the momentum is shifting in the bears’ favor, and a bearish breakout could be slightly more probable at this moment.
Onchain Analysis
By Shayan
Binary CDD (100-day SMA)
The long-term holders are a critical cohort among participants. Hence, tracking their behavior might help in determining the market’s direction.
The Binary Coin Days Destroyed metric can be used to determine the long-term holders’ activity. This metric points to 1 if Supply Adjusted Coin Days Destroyed is larger than the average Supply-Adjusted CDD and points to 0 if not.
The following chart depicts the Binary CDD metric (100-day SMA) alongside Bitcoin’s price. A surge in it implies probable selling pressure from the long-term holders, which usually happens in the market tops and during the capitulation phases.
The metric surged significantly during the 2017 and 2020 bull runs and dramatically dropped during the 2018 and 2021 bear markets. Currently, it has fallen considerably and made new local lows.
However, there is still room for another plummet in the metric compared to the 2018 low. This indicates that we are close to the bear market bottom formation, but another bearish rally might still be on the table for Bitcoin.

Binance Free $100 (Exclusive): Use this link to register and receive $100 free and 10% off fees on Binance Futures first month (terms).
PrimeXBT Special Offer: Use this link to register & enter POTATO50 code to receive up to $7,000 on your deposits.
Disclaimer: Information found on CryptoPotato is those of writers quoted. It does not represent the opinions of CryptoPotato on whether to buy, sell, or hold any investments. You are advised to conduct your own research before making any investment decisions. Use provided information at your own risk. See Disclaimer for more information.
Cryptocurrency charts by TradingView.
[ad_2]
Source link