
[ad_1]
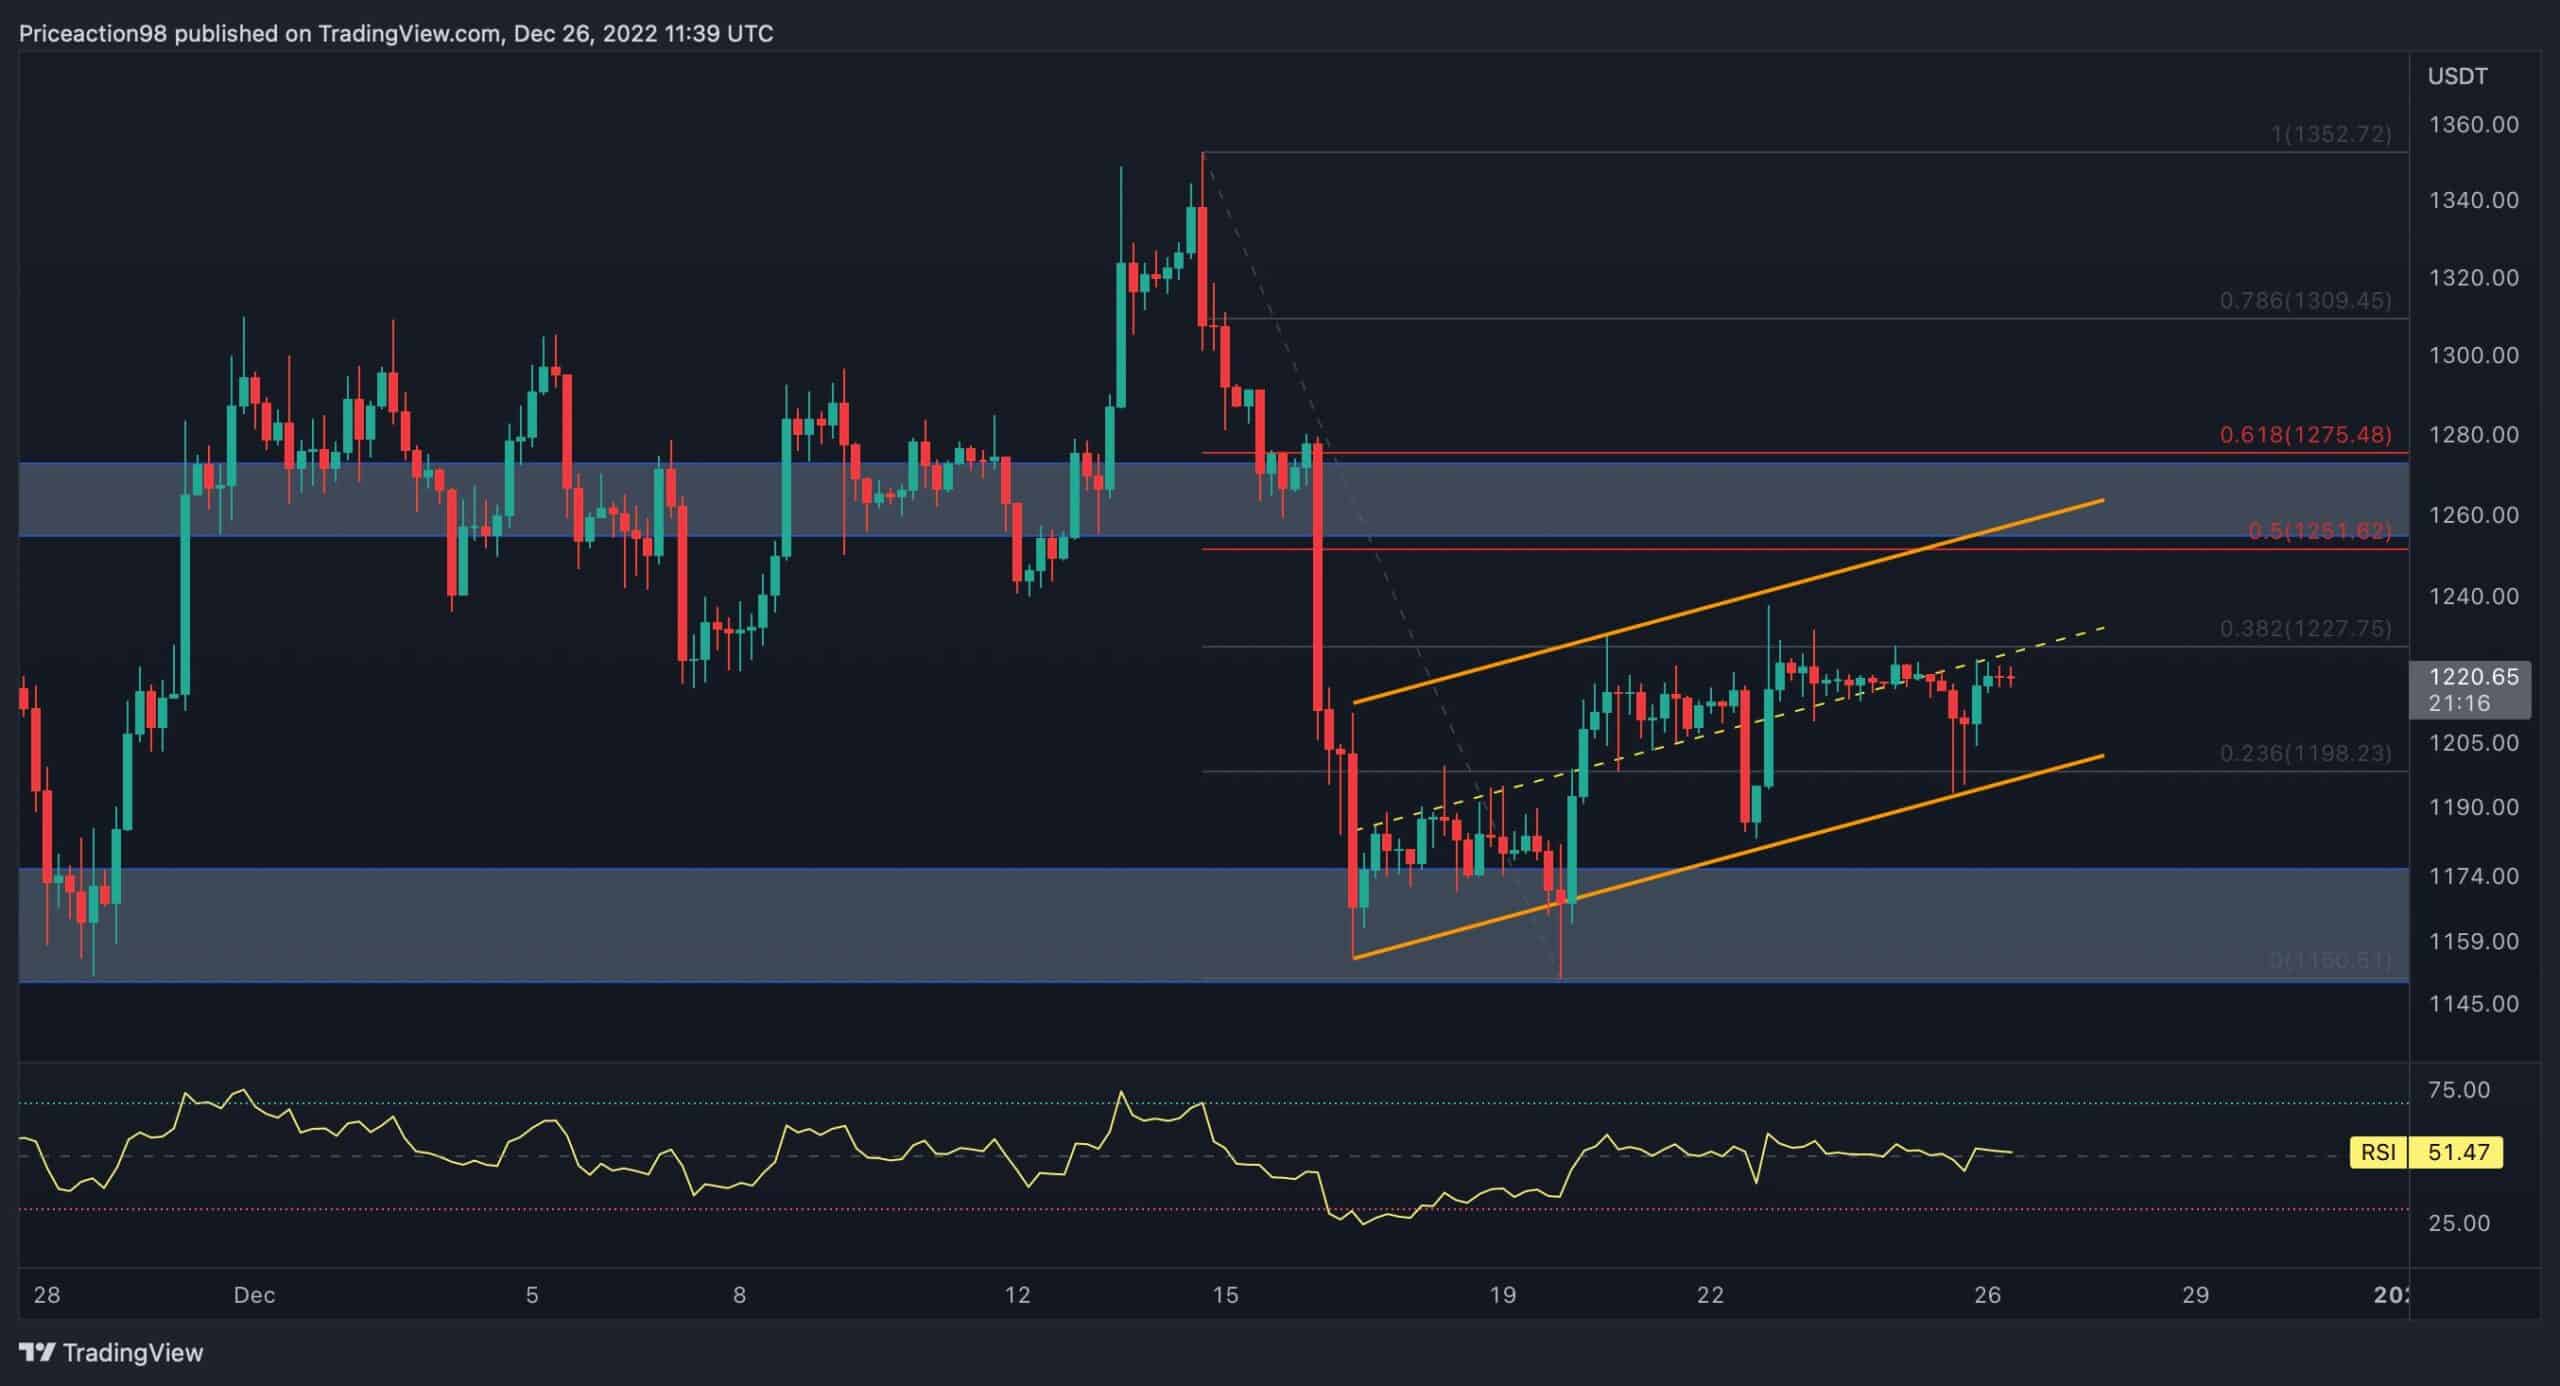
Over the past few weeks, we saw a mini-rally that was initiated at the wedge’s lower boundary (shown below); however, Ethereum’s uptrend was halted by the 50-day moving average line significant resistance level. Since the rejection, ETH has seen consolidation in a very tight range. Another bearish leg might soon start unless the price breaks above $1236.
Technical Analysis
By Shayan
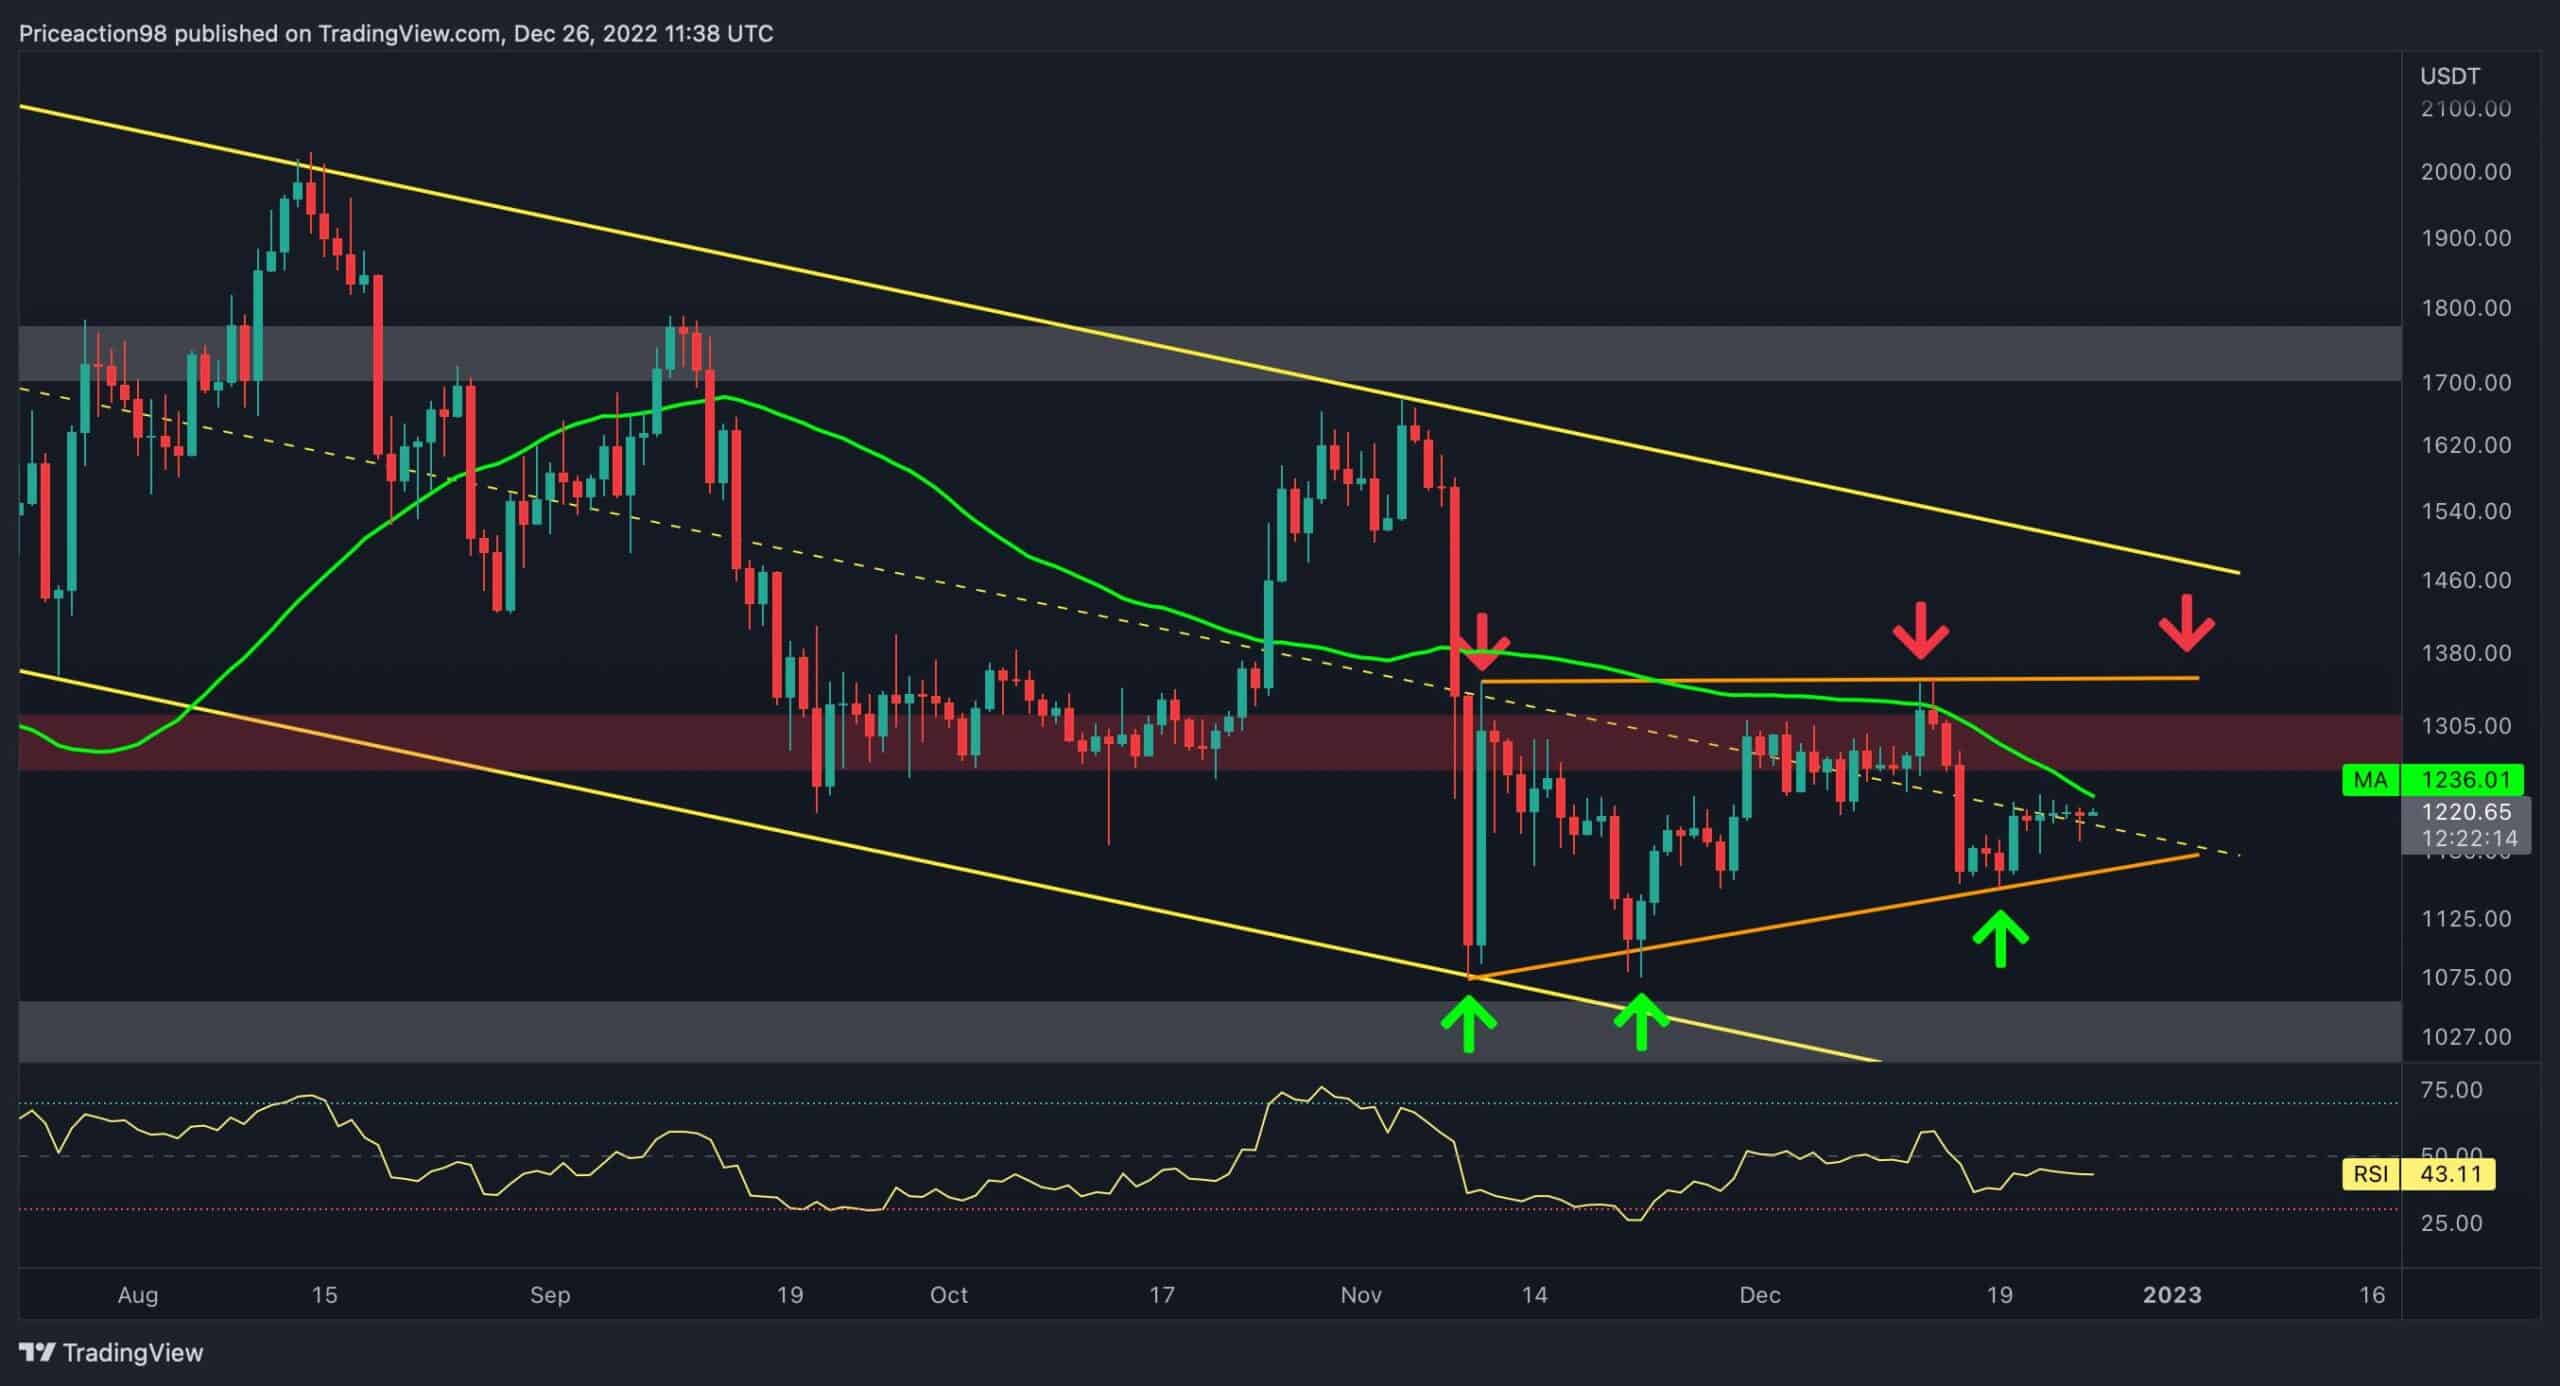
The Daily Chart
After a sudden crash below the static support level of $1300, the price has consolidated and formed an ascending wedge pattern (shown by the orange trendlines).
Most recently, after a third touch of the lower boundary, Ethereum started an uptrend and reached the 50-day moving average line at $1236. However, the 50-day moving average line aligns with the descending channel’s middle threshold, causing this level to become a major resistance.
Ethereum bulls should expect another uptrend toward the wedge’s upper trendline if the price surpasses this crucial resistance zone. Still, considering the recent price action and weakened bullish momentum, rejection from this level is more likely.
The 4-Hour Chart
Based on the classic technical point of view, each impulsive price move should be followed by a short-term continuation correction phase. This also applies to Ethereum’s price action. The chart illustrates that the price has dropped sharply and entered a short-term consolidation phase. Meanwhile, an ascending bearish flag pattern has been formed.
The price is currently attempting to exceed the flag’s middle boundary, and if a breakout takes place, a surge toward the upper trendline will become likely. However, as mentioned earlier, the current market structure is not promising for the bulls. Accordingly, the most probable scenario for Ethereum is a short-term consolidation followed by another plummet toward the crucial support level of $1K.
On-chain Analysis
The following chart consists of the Transaction Count metric (30-day EMA) and Ethereum’s price. Typically, bearish stages of the market are followed by significantly lower activity from the market participants, resulting in a lower transaction count.
Based on this metric, the market activity level has been on a downtrend since May 2021 and even recorded a new low. Furthermore, as is evident in the chart, each impulsive downtrend in the metric was along with a considerable price decline.
Most recently, the metric experienced a significant plunge indicating a lack of activity. Hence, the price might soon experience another drop to the crucial support level of $1K.
![]()
Binance Free $100 (Exclusive): Use this link to register and receive $100 free and 10% off fees on Binance Futures first month (terms).
PrimeXBT Special Offer: Use this link to register & enter POTATO50 code to receive up to $7,000 on your deposits.
Disclaimer: Information found on CryptoPotato is those of writers quoted. It does not represent the opinions of CryptoPotato on whether to buy, sell, or hold any investments. You are advised to conduct your own research before making any investment decisions. Use provided information at your own risk. See Disclaimer for more information.
Cryptocurrency charts by TradingView.
[ad_2]
Source link