
[ad_1]
After a lengthy period of defending the $1200, Ethereum momentarily fell below this level, followed by a quick recovery to $1,343. This price action highlights the significance of demand below the $1200 support level.
Technical Analysis
By Grizzly
The Daily Chart:
At the time of writing, the market has recovered from the volatility caused by the recently announced CPI numbers for September. Ethereum has returned to the 200-week moving average (in white). Considering the 61.8% Fib level at $1,210 (in yellow), it’s expected that this level will be critical to defend.
In a bearish scenario, if ETH drops below $1,200 again, the probability of continuing the correction increases accordingly. The longer the market struggles with this level, the more buy orders will be filled, weakening the buyers. Therefore, the failure of this level could lead to touching the psychologically important level of $1,000.
The negative sentiment, on the other hand, will dimmish if the horizontal level at $1,400 (in red) is reclaimed. In this scenario, ETH could even put a halt to the ongoing bearish structure in the short term.
Key Support Levels: $1210 & $1000
Key Resistance Levels: $1400 & $1550
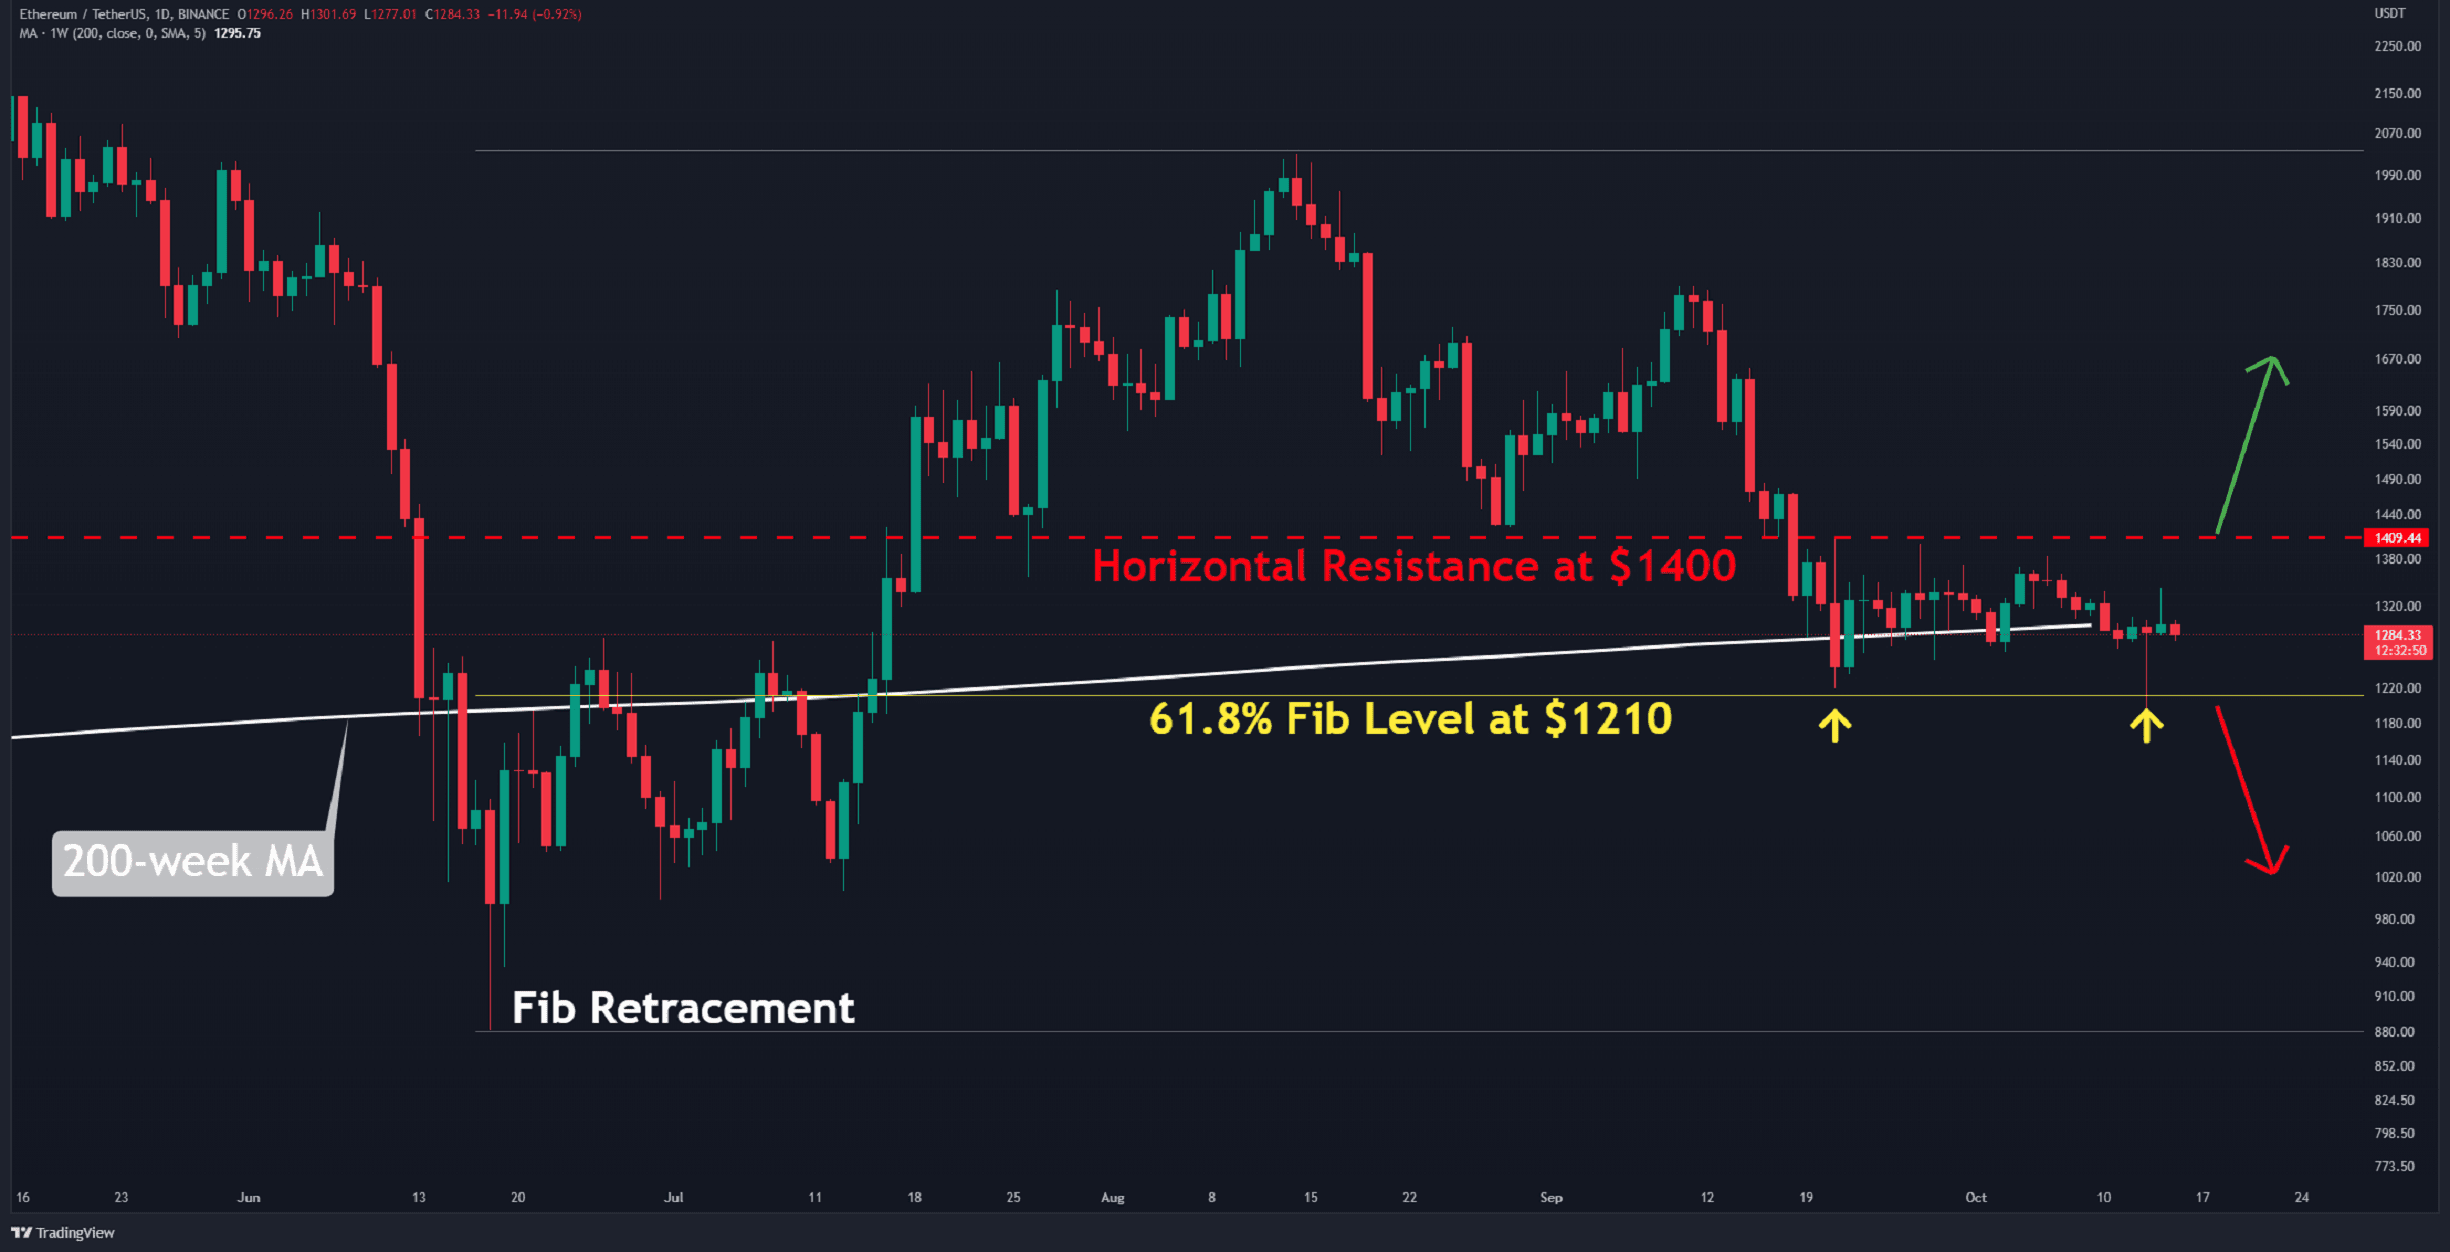
Daily Moving Averages:
MA20: $1317
MA50: $1434
MA100: $1510
MA200: $1838
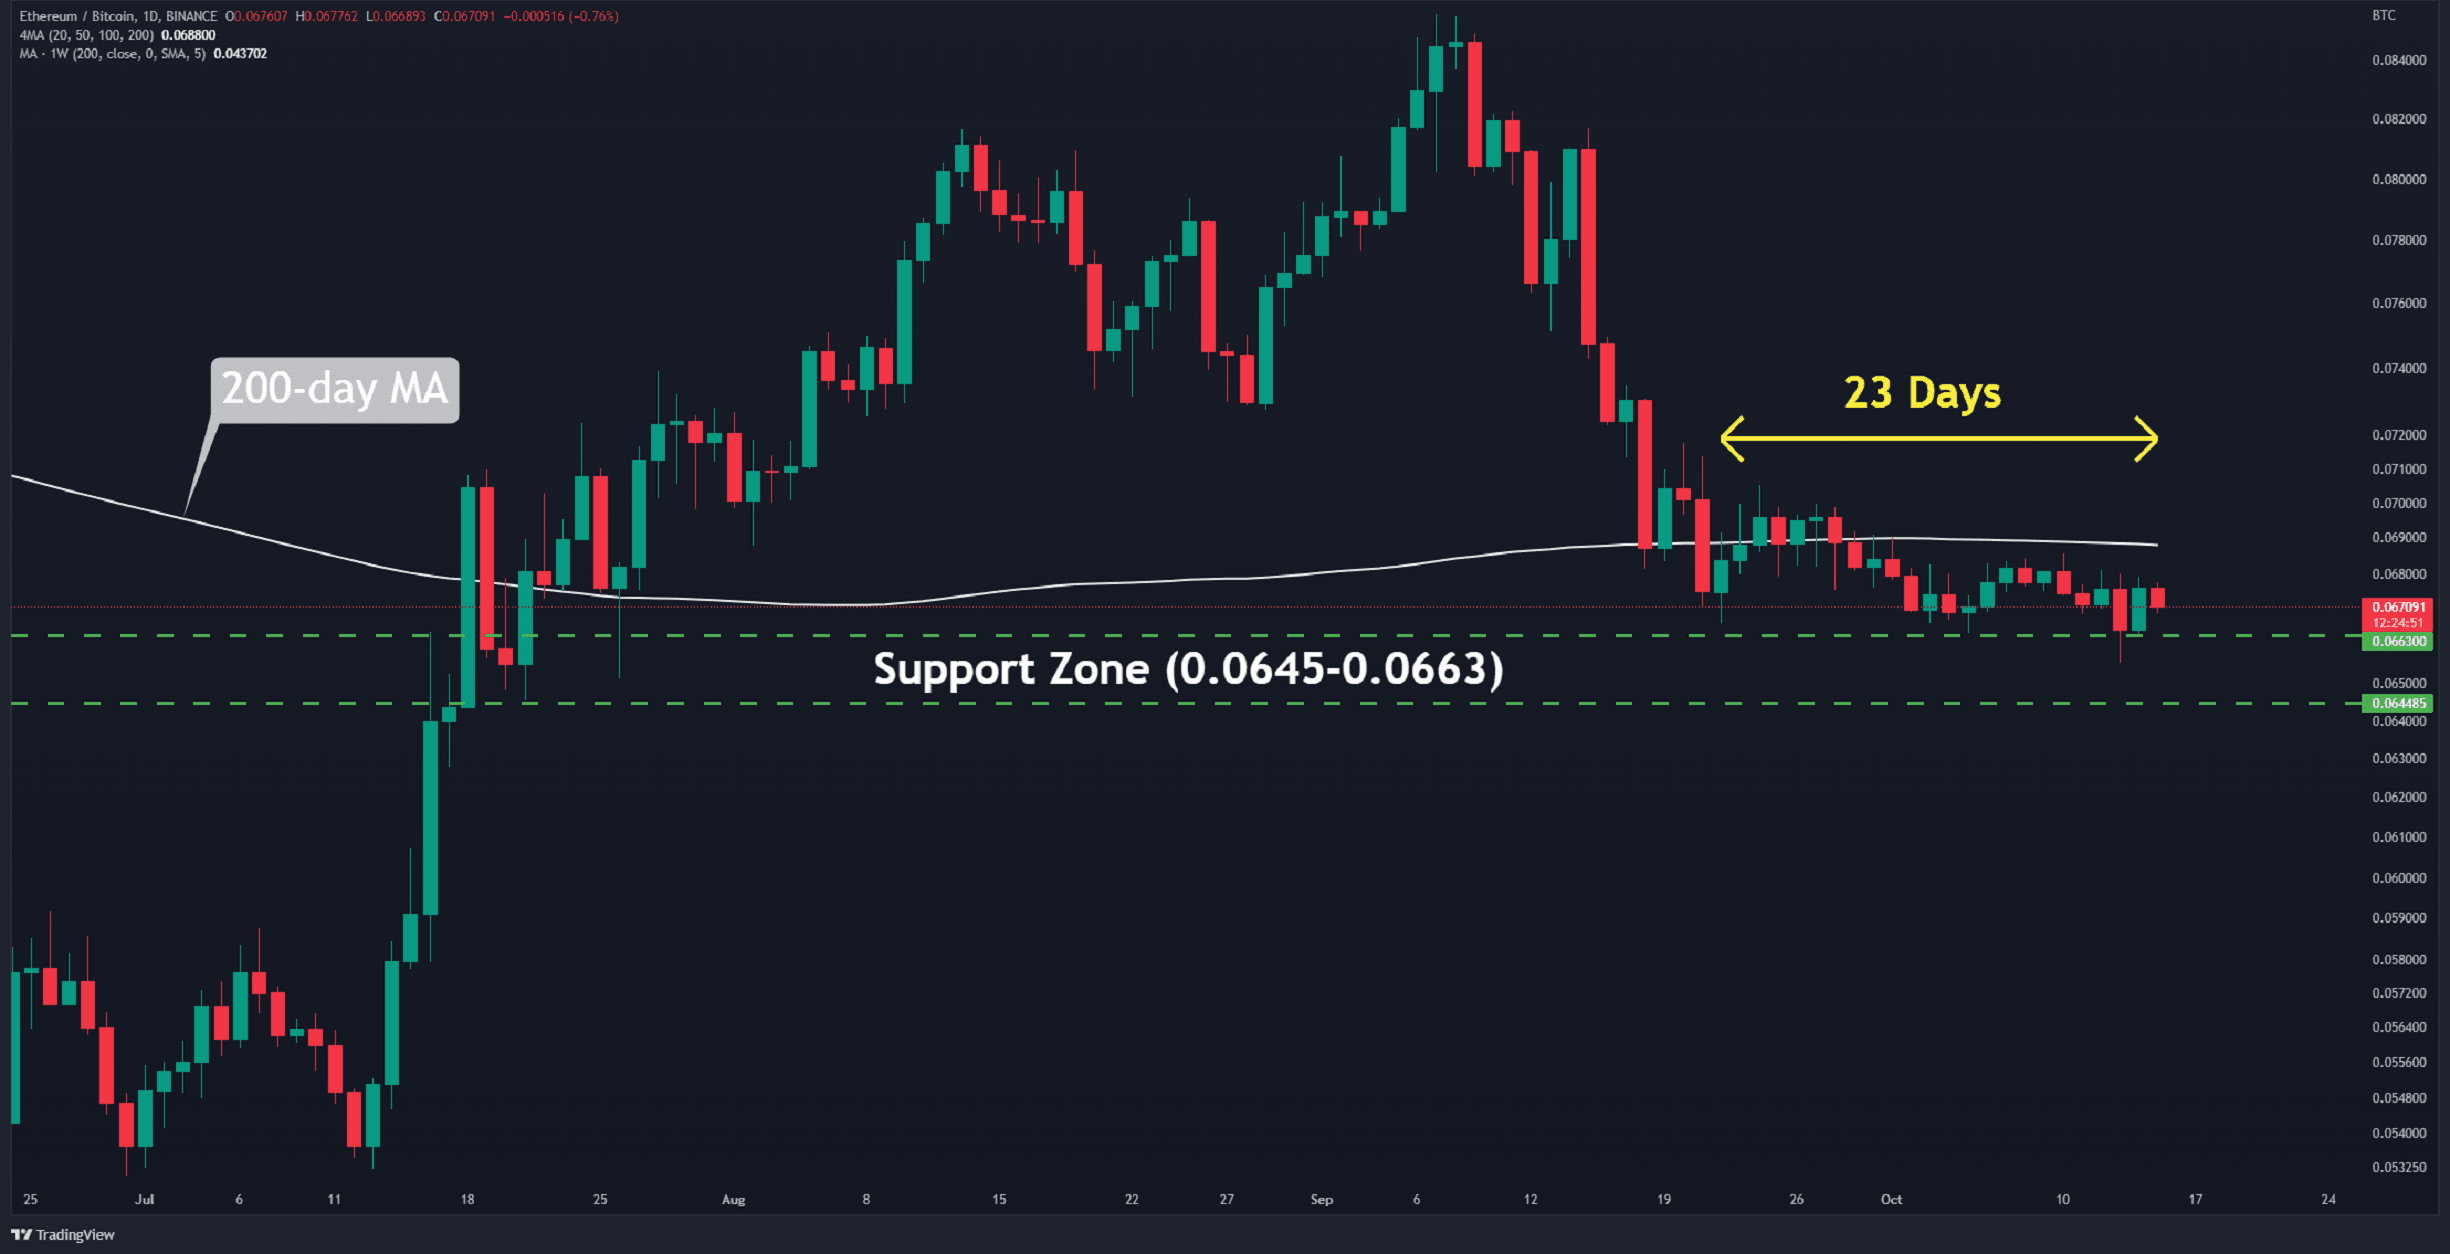
The ETH/BTC Chart:
ETH is showing a high correlation to Bitcoin over the last 23 days. Generally, spot price trading below the 200-day moving average (in white) suggests the dominance of bearish sentiment in the market. Furthermore, the range of 0.0645 to 0.0663 BTC (in green) resembles a support zone structure. If the price of ETH goes below it, the market can see another correction. If that turns out to be the case, further support can be expected at around 0.06 BTC.
Key Support Levels: 0.0645 & 0.06 BTC
Key Resistance Levels: 0.073 & 0.08 BTC
Sentiment Analysis
Taker Buy Sell Ratio (SMA 14)
Definition: The ratio of buy volume divided by the sell volume of takers in perpetual swap trades.
Values over 1 indicate bullish that the sentiment is dominant, while values under 1 indicate that the bearish sentiment is dominant.
According to CryptoQuant data, takers always tend to fill sell orders as the index is below 1 (in blue). Therefore, this metric increased above 1 for a brief period in early October, but buyers failed to keep their positive momentum.
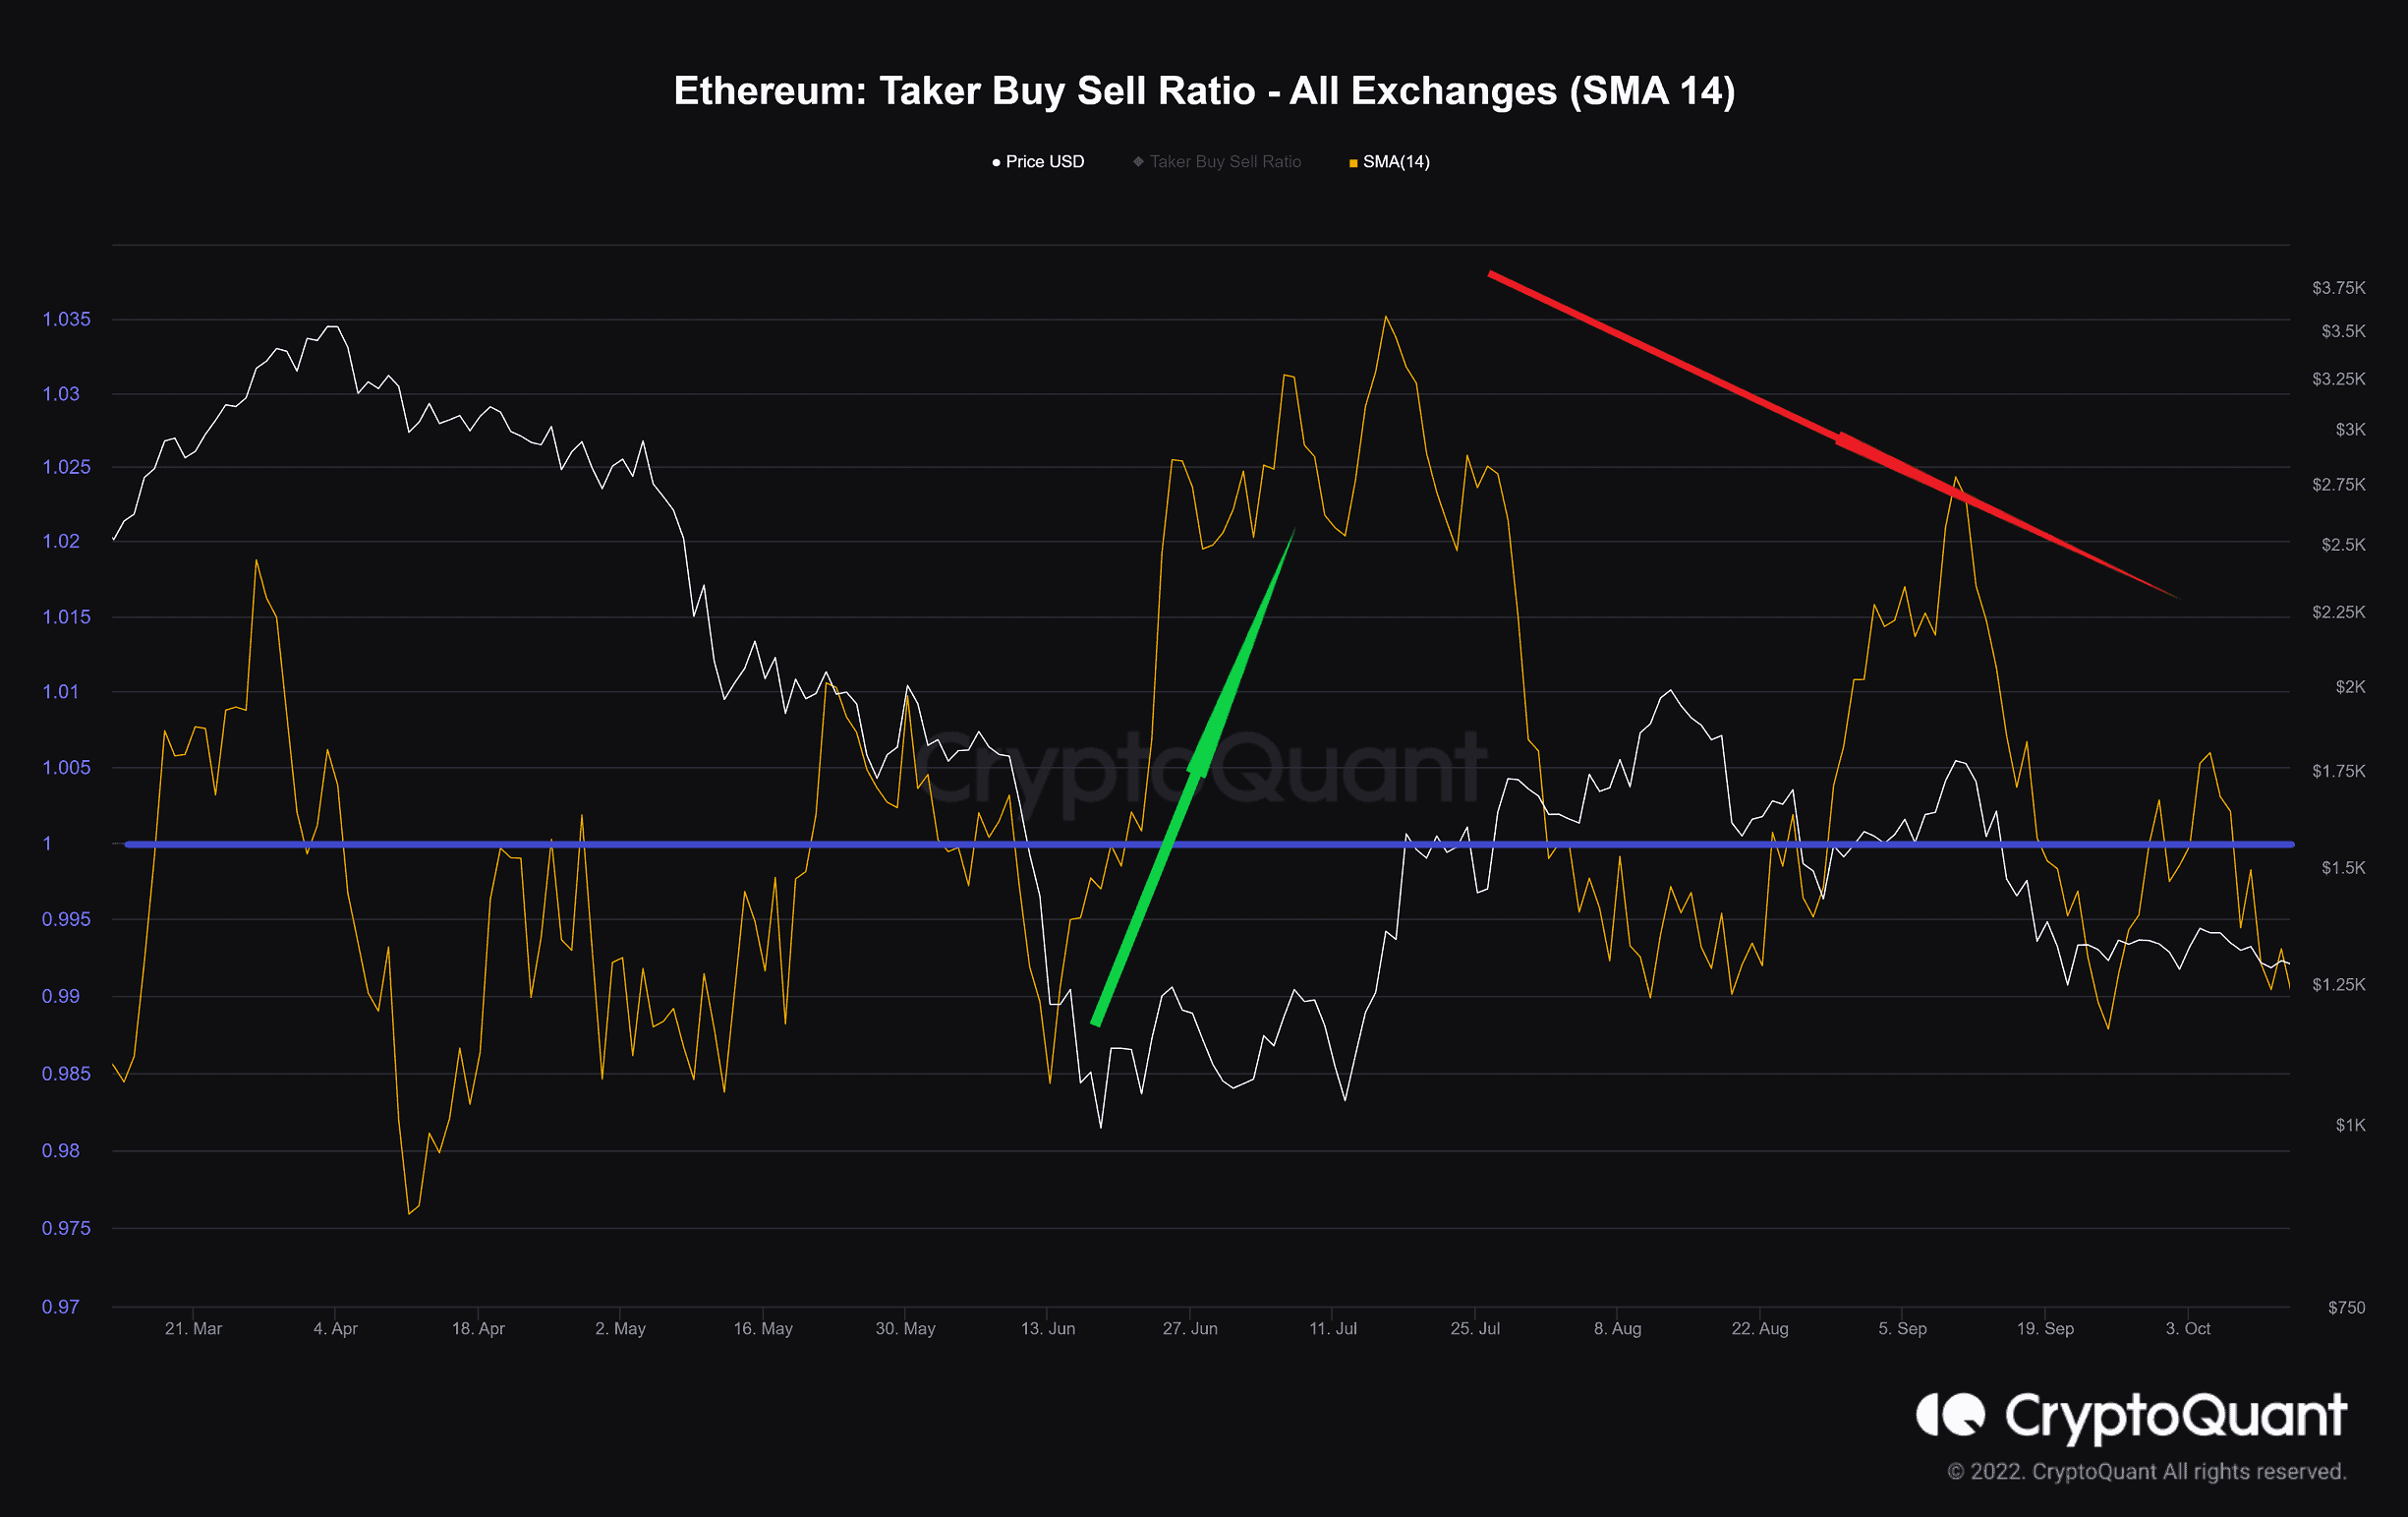
The highlighted structure in this chart indicates that takers’ buy-side in the derivative market has been dropping in the macro trend since mid-July (in red), and any short-term recovery is likely to fail until the macro trend changes its direction.
Binance Free $100 (Exclusive): Use this link to register and receive $100 free and 10% off fees on Binance Futures first month (terms).
PrimeXBT Special Offer: Use this link to register & enter POTATO50 code to receive up to $7,000 on your deposits.
Disclaimer: Information found on CryptoPotato is those of writers quoted. It does not represent the opinions of CryptoPotato on whether to buy, sell, or hold any investments. You are advised to conduct your own research before making any investment decisions. Use provided information at your own risk. See Disclaimer for more information.
Cryptocurrency charts by TradingView.
[ad_2]
Source link